- GBP/USD wavers around intraday low while keeping late Friday’s recovery from 1.3863.
- Upbeat RSI, sustained trading above 200-HMA, one-week-old rising trend line favor bulls.
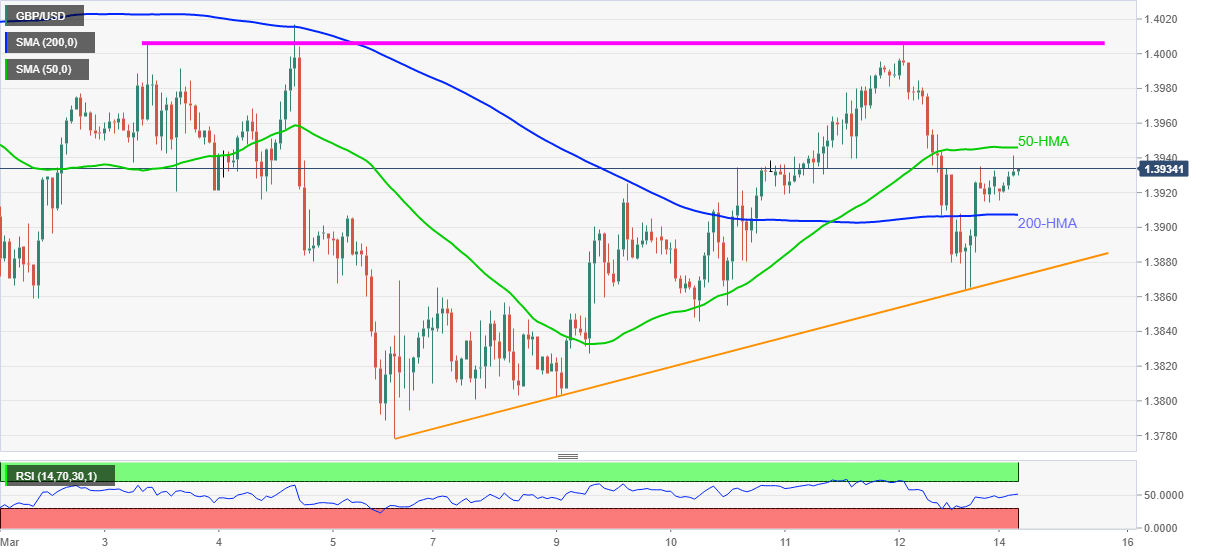
- 50-HMA guards immediate upside ahead of short-term horizontal hurdle.
GBP/USD wavers around an intraday high of 1.3941, currently up 0.05% near 1.3932, amid Monday’s Asian session. In doing so, the quote remains positive above 200-HMA and an upward sloping trend line from March 05 amid normal RSI conditions.
As a result, the bulls can continue dominating the GBP/USD prices ahead of confronting the 50-HMA level of 1.3946.
In a case where the GBP/USD buyers manage to cross the 1.3946 HMA hurdle, a horizontal area comprising highs marked since March 03 around 1.4005 will be the key follow.
Meanwhile, pullback moves may have a little impact on the pair’s uptrend unless breaking the stated support line near 1.3870. Though, a re-test of 200-HMA around 1.3905 can’t be ruled out.
It’s worth mentioning that a clear break of the stated support line will eye for the monthly support line 1.3775.
GBP/USD hourly chart
Trend: Bullish
