- USD/JPY stays on the bids, currently around intraday high, following its U-turn from 200-HMA.
- Strong RSI favors run-up to weekly resistance line.
- 61.8% Fibonacci retracement adds to the downside support.
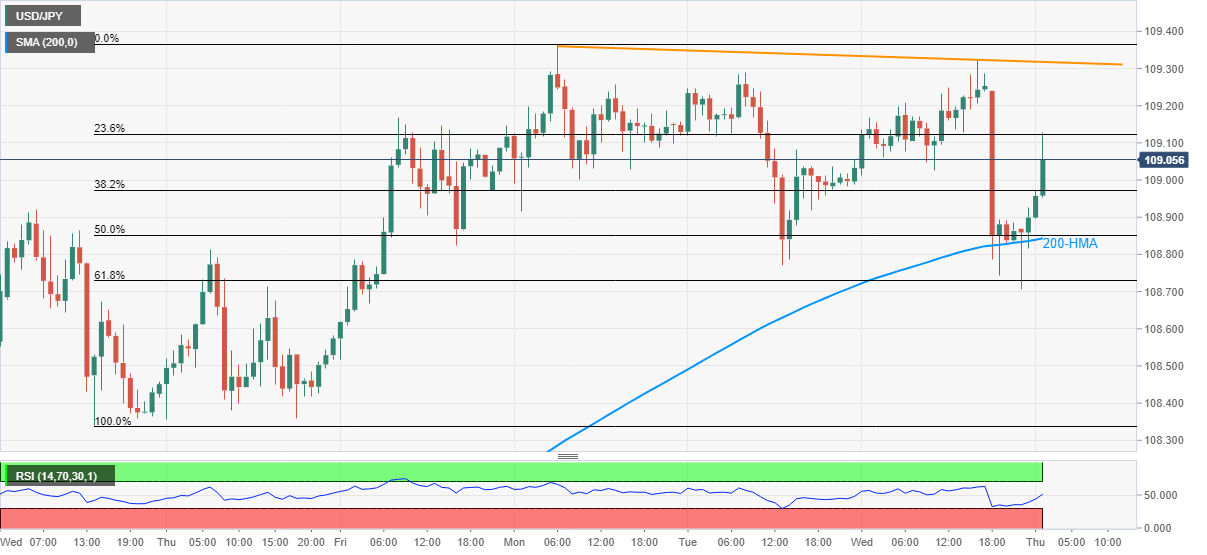
USD/JPY eases from an intraday high of 109.12 to currently around 109.06, up 0.21% on a day, during early Thursday. However, the quote remains on the front foot after reversing from the key moving average and Fibonacci retracement levels of March 10-15 upside.
Given the strong RSI conditions back the USD/JPY run-up, a downward sloping trend line from Monday, currently around 109.30 seems to lure the intraday bulls.
However, any further upside needs to refresh the multi-day top of 109.36, marked earlier in the month, to direct the optimists toward the June 2020 peak of 109.85.
Meanwhile, a confluence of 200-HMA and 50% Fibonacci retracement near 108.85 restricts the immediate downside of USD/JPY prices.
Also challenging the sellers could be 61.8% Fibonacci retracement level of 108.73 and the previous week’s low surrounding 108.35.
Overall, the Fed-led risk-on could propel the USD/JPY bounce off key HMA towards a fresh multi-day top.
USD/JPY hourly chart
Trend: Bullish
