- USD/INR trims the last week’s bounce off monthly low, prints three-day downtrend.
- Sustained trading below 100-week SMA, bearish signals from SuperTrend favor sellers.
- 11-month-old resistance line, previous support line from January 2018 probe bulls.
USD/INR remains on the back foot, recently taking offers around 72.38 during the Indian session on Tuesday. In doing so, the quote extends the previous week’s downside break of 100-week SMA while respecting a seven-month-old sell signal per the SuperTrend technical indicator.
Against this backdrop, USD/INR bears are currently eyeing the yearly bottom surrounding 72.20 but top marked during early 2020 and the 72.00 threshold seems to test the pair’s further weakness.
Also filtering the USD/INR downside moves is the February 2019 peak surrounding 71.80.
Meanwhile, an upside clearance of 100-week SMA, at 72.67 now, need not be considered as a bullish signal as a falling trend line from April 2020 and a multi-month-old resistance line, respectively around 73.85 and 74.00, will be strong challenges for the USD/INR bulls.
Overall, USD/INR flashes clear downside signals towards the early 2020 levels.
USD/INR weekly chart
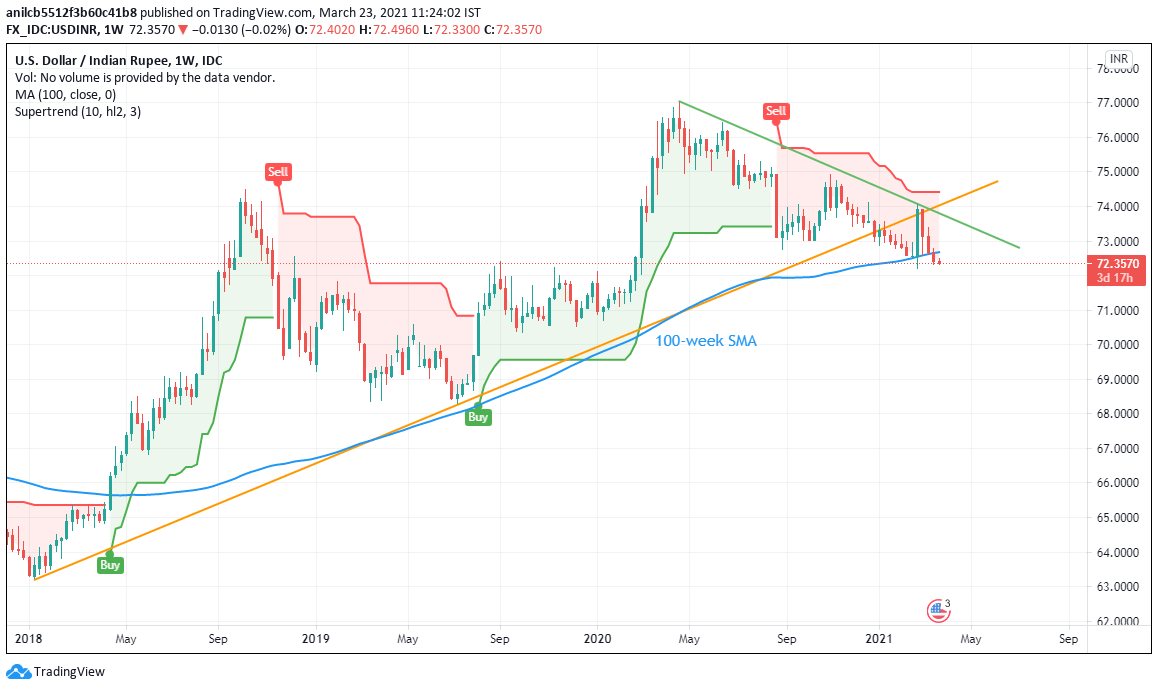
Trend: Bearish
