- Bulls keep hold of the reigns at the start of the week with the price holding $1,730.
- USD could be due for a significant correction on the daily chart.
- Both hourly and daily resistances are in focus.
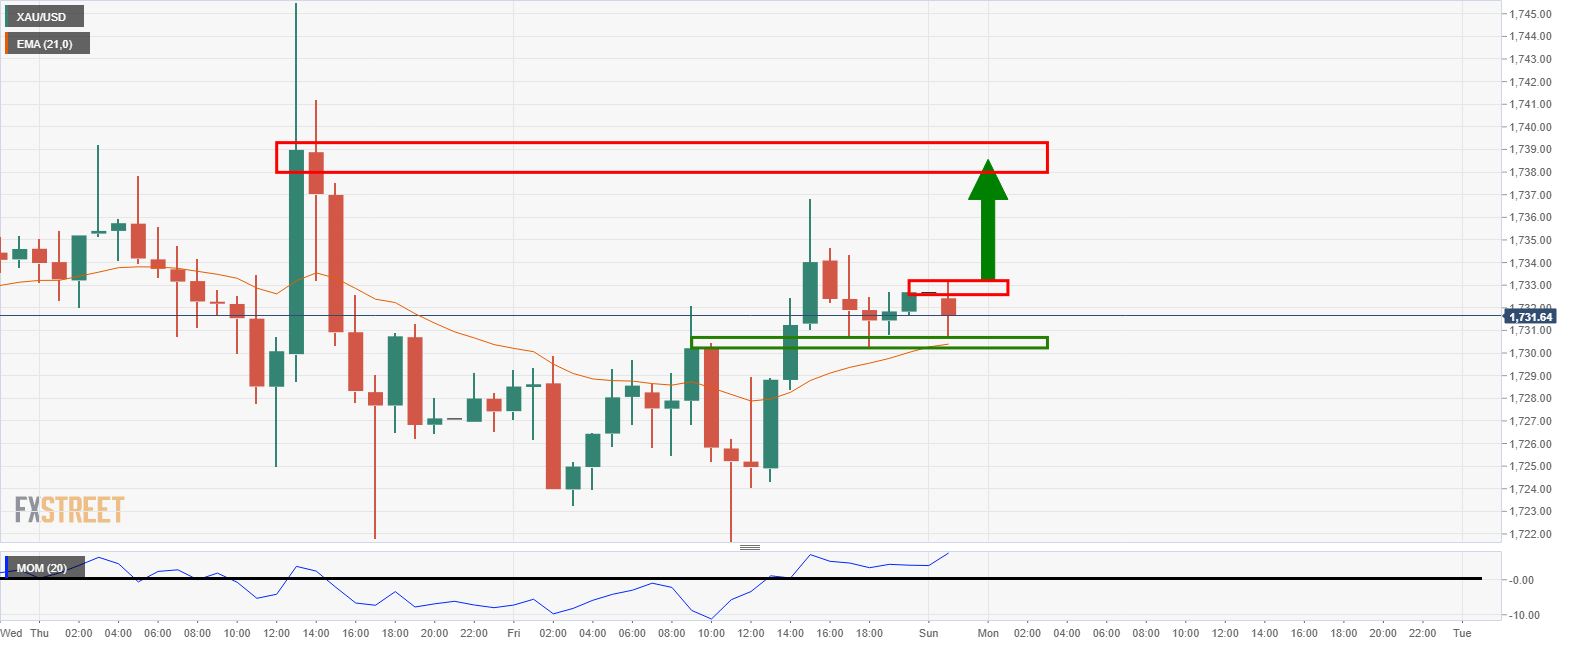
Gold bulls seek a test of hourly resistance ahead of a break of the daily 21 EMA.
The following illustrates the market structure and where the next opportunity could come of a bullish surge.
Gold, daily chart
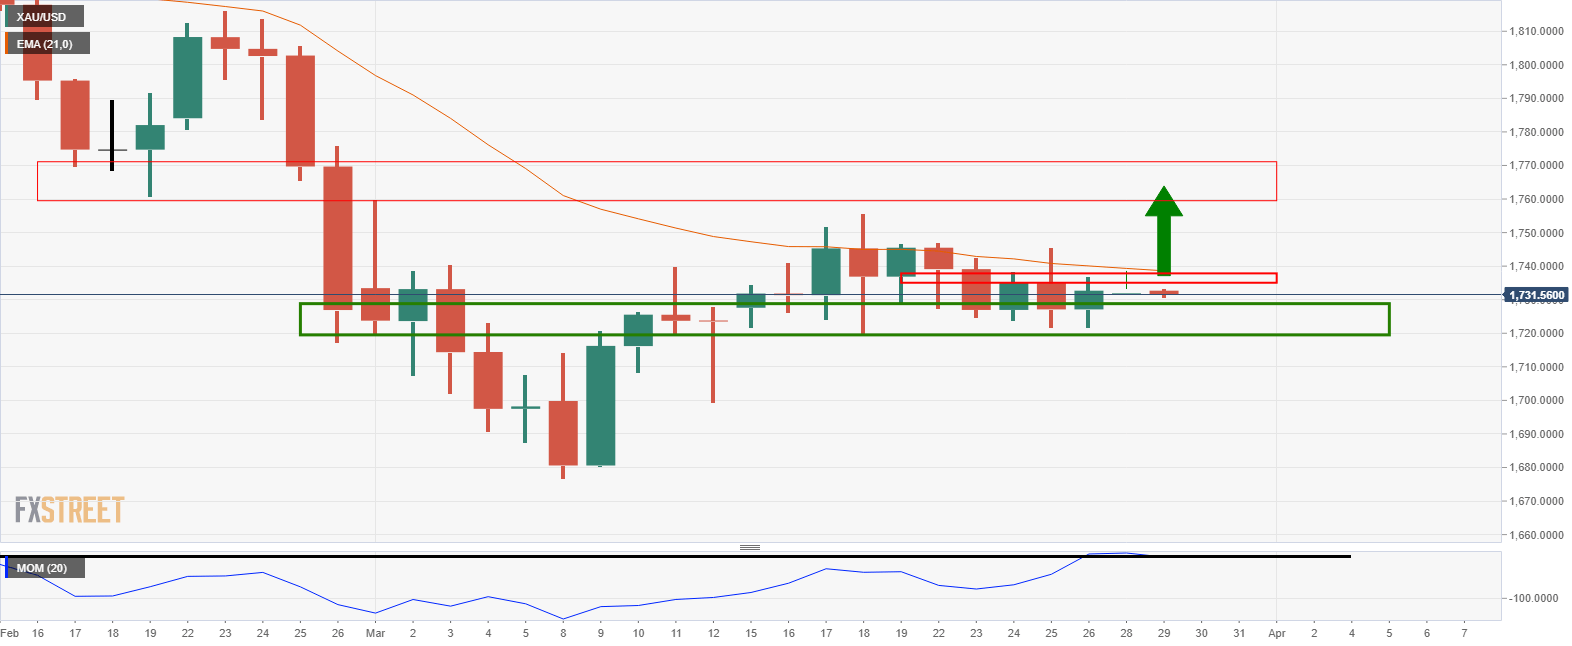
The price is holding daily support and there are prospects of an extension of the current correction.
Gold, 1-hour chart
DXY daily chart
Meanwhile, there are bearish prospects at least for the meanwhile, as we approach quarter-end and the price as measured by the DXY starts to correct.
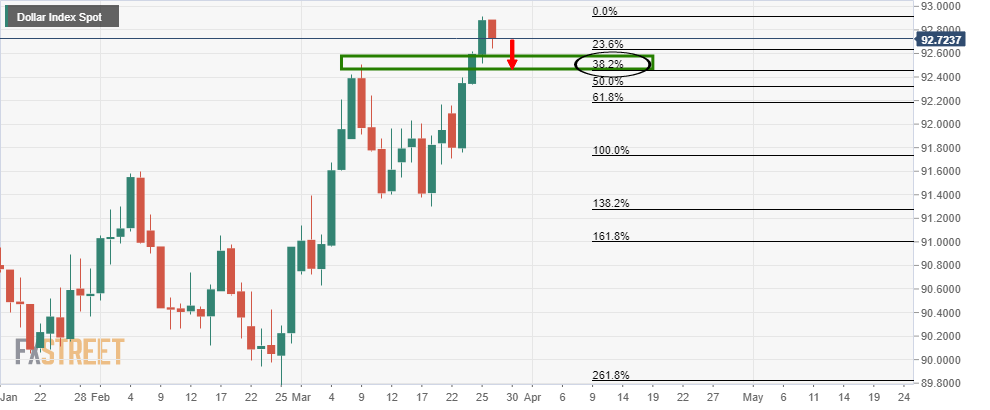
If the bulls can hold and get above the current resistance, then there are meanwhile expectations of a test of prior resistance.
