- Silver clings onto the $24.80 support zone but the downside remains intact.
- A symmetrical triangle breakdown confirmed on the hourly chart.
- RSI has rebounded but remains below the 50.00 level.
Silver (XAG/USD) licks it wounds while trading in a tight range between $25 and $24.80 levels, as the bears catch a breather before the next push lower.
The white metal remains exposed to downside risks after it confirmed a symmetrical triangle breakdown on the hourly sticks in early Asia.
Silver Price Chart: Hourly
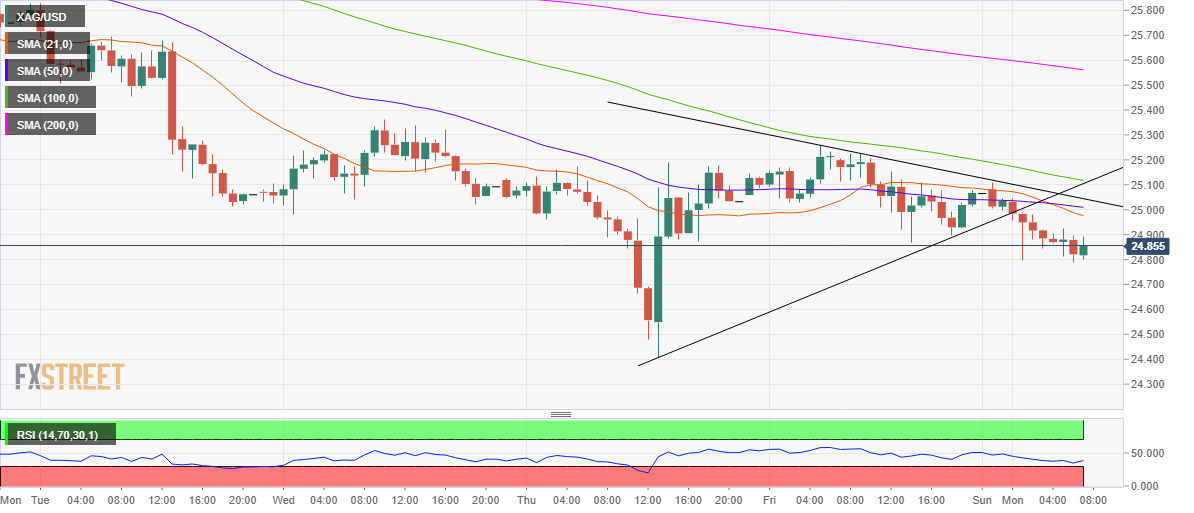
Although the spot attempts a bounce in tandem with the Relative Strength Index (RSI), which has also recovered from lower levels. Despite the upturn in the RSI, the momentum indicator still trades below the 50.00 level, suggesting that the downside bias remains in place.
Therefore, a sustained move below the $24.80 support could call for a test of Thursday’s low of $24.41.
On the flip side, if the abovementioned support holds, the recovery could extend towards the bearish 21-hourly moving average (HMA) at $24.97.
Further up, the $25.50 psychological level could be challenged.
Silver Additional levels
