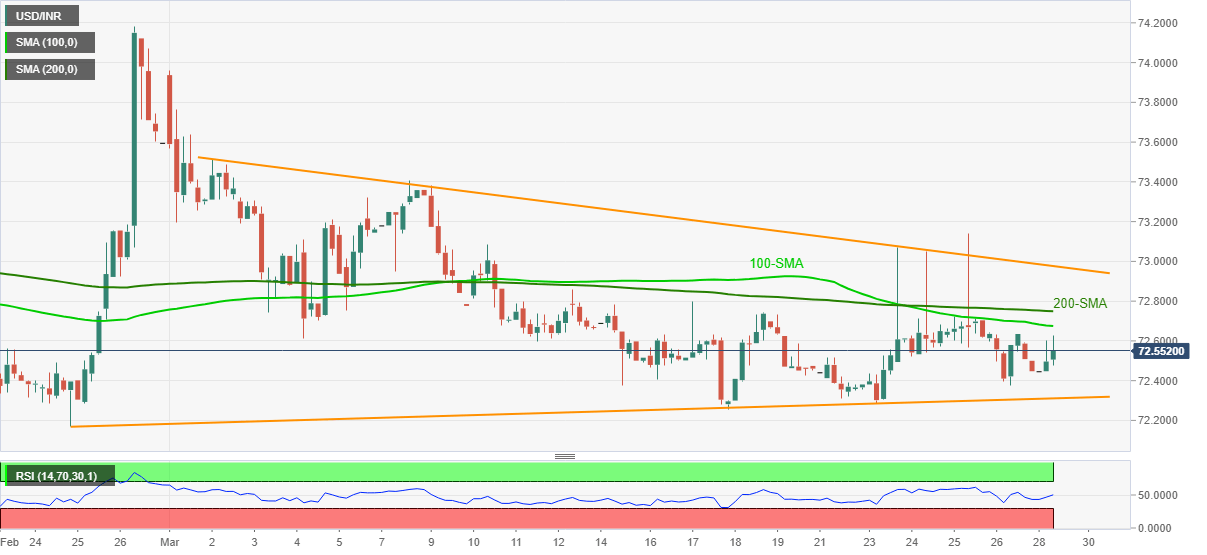
- USD/INR picks up bids towards 100-SMA, stays inside the short-term triangle.
- RSI recovery suggests upside momentum building under the bullish chart formation.
- Bears have multiple barriers to tackle before refreshing the yearly low.
USD/INR prints 0.20% intraday gains while taking the bids near 72.58 ahead of Monday’s European session.
Having witnessed multiple days of range-bound trading below 100 and 200-SMAs, USD/INR bears finally seem to lose the patience. However, a confirmation of the falling triangle, via an upside break of 72.98, is a must for recalling the buyers.
Before that, 100-SMA and 200-SMA, respectively around 72.67 and 72.75, should be tackled.
Meanwhile, pullback moves may revisit 72.40 and the stated triangle’s support line, near 72.30, before eyeing the yearly bottom near 72.17.
During the fall, 72.28 and 72.25 can offer intermediate halts whereas the 72.00 threshold can entertain traders afterward.
USD/INR four-hour chart
Trend: Upside expected
