- AUD/JPY witnesses corrective pullback after confirming a bearish chart formation the previous day.
- RSI recovery suggests further bounces off the key HMA.
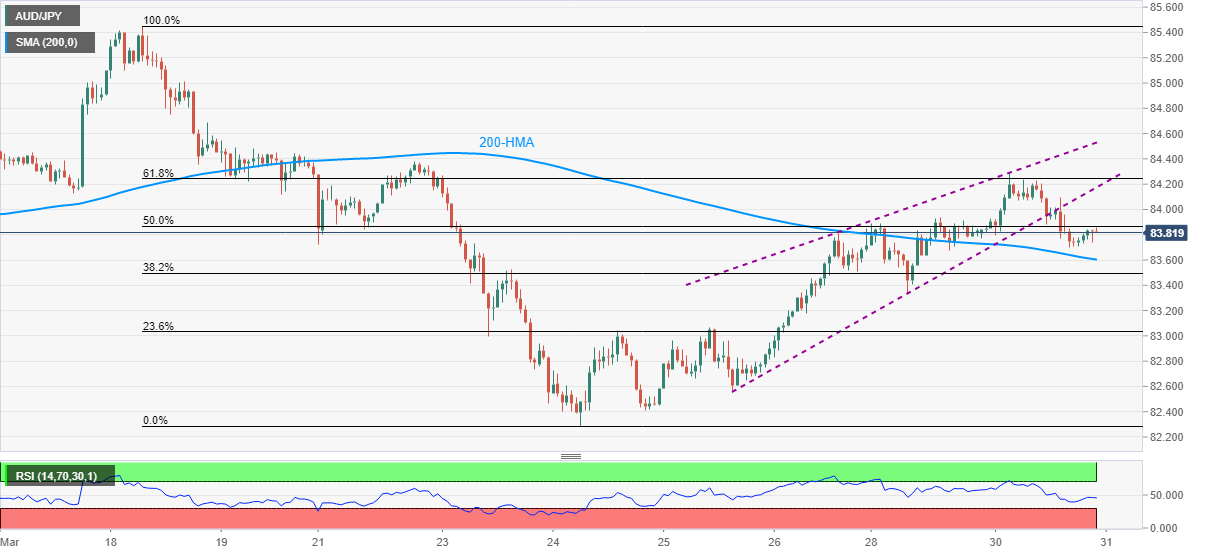
- 50% and 61.8% Fibonacci retracement levels offer extra resistance levels to watch.
AUD/JPY picks up bids to 83.85 during the initial Asian session trading on Wednesday. In doing so, the quote takes a U-turn from 83.59, within a small distance of 200-HMA support, but keeps the downside break of rising wedge bearish formation.
Given the confirmation of the bearish chart pattern, the pair’s latest bounce is less likely to convince buyers for re-entry unless rising past-61.8% Fibonacci retracement of March 18-24 downside, around 84.25.
Though, the lower line of the stated wedge formation, near 84.17, guards the immediate upside.
Should AUD/JPY rises past-84.25, the mid-84.00s can lure the bulls.
Meanwhile, 200-HMA close to 83.60 restricts the pair’s immediate downside ahead of the weekly bottom surrounding 83.33.
In a case where AUD/JPY sellers retake controls past-83.33, the 83.00 round-figure will be the key to watch.
AUD/JPY hourly chart
Trend: Further recovery expected
