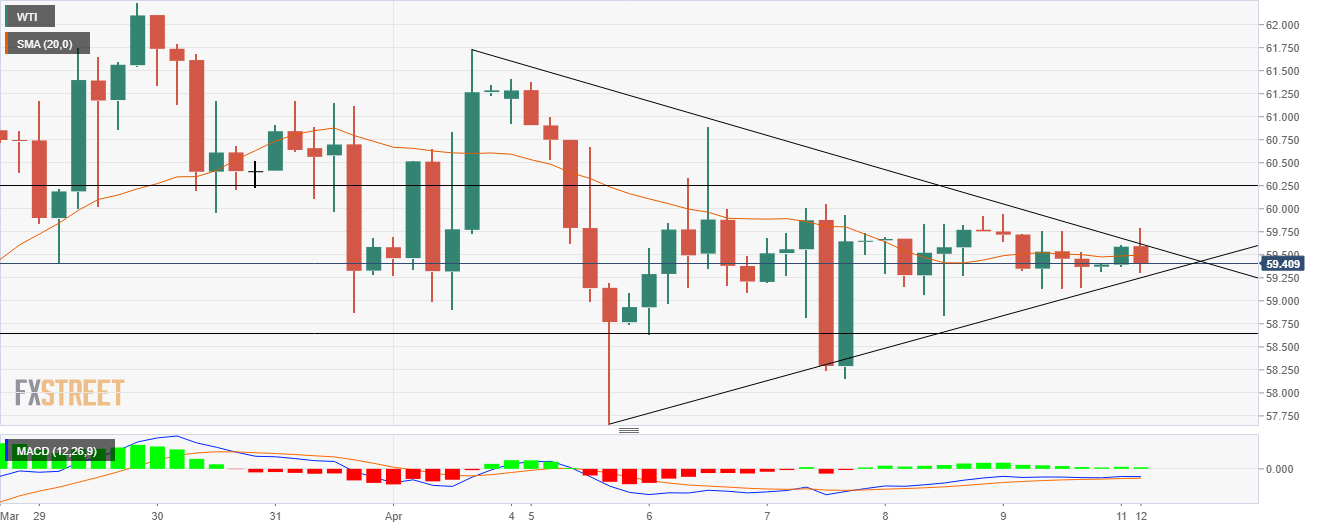
- WTI trades below $59.70, the ascending trendline on the 4H chart.
- A symmetrical triangle points toward a bearish breakout.
- However, neutral momentum oscillator warrants caution for aggressive bids.
WTI trades with a softer tone on Monday following the previous week’s subdued price action. Crude oil moves in a narrow trade band where lows are restricted around the $59.10 neighborhood and the highs near the $59.75 region.
At the time of writing, the US oil is trading at $59.34, up 0,07% on the day.
WTI Four-hour chart
On the four-hourly chart, the formation of a symmetrical triangle suggests that a breakout could happen on either side of the cross. However, the bias remains to the downside. The price is just placed above the 20-hour simple moving average (SMA).
On the downside, the price would move towards the $58.75 horizontal support level first and then it could find the next support near $57.63. This would also coincide with the breach of the ascending trendline further opening the path towards weekly lows near the $57.65 level.
The Moving Average Convergence Divergence (MACD) momentous oscillator reads below the midline with a bullish crossover, which throws some caution for the bears.
On the flip side, if the price is starting to move beyond the 20-hour SMA, which is placed at $59.50, then it would negate the possibility of a bearish breakout, pushing the prices toward a $60.25 horizontal resistance zone. The next hurdle appears to be last week’s tops of $61.50.
WTI additional levels

