- GBP/USD is on the verge of a bearish extension according to the daily chart.
- A bearish head and shoulders are in the makings.
GBP/USD has formed a compelling case for the downside where technicals meet the positing data bias.
Futures positions are weakening in long cable and the longer-term technicals are also bearish.
The following is a top-down analysis that illustrates the bearish market structures:
Monthly chart
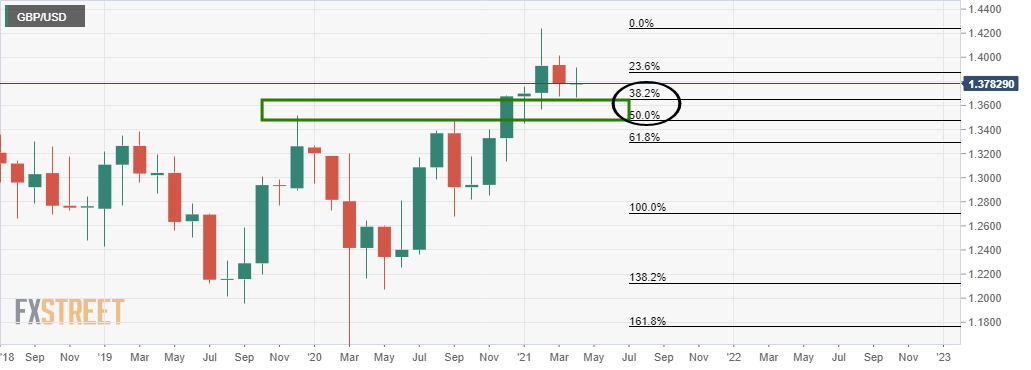
The price has started to move lower on the monthly horizon and a fuller retracement to test old resistance could be on the cards in a 50% mean reversion of the last monthly bullish impulse.
Weekly chart 1
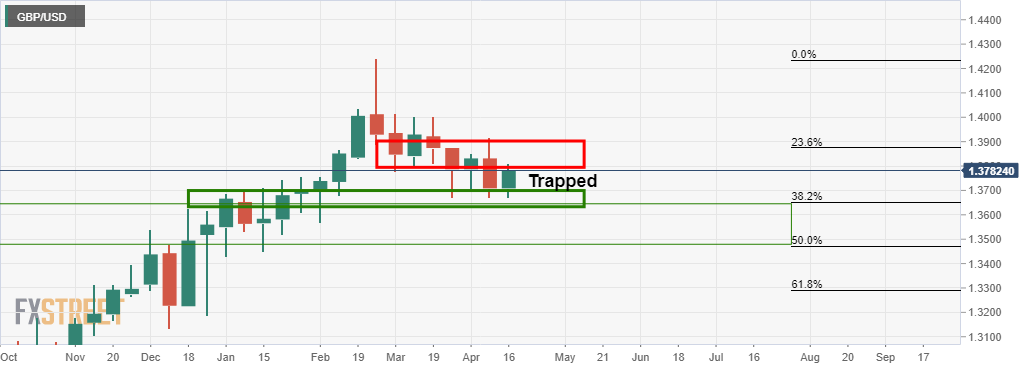
At first glance, however, the price seems destined to consolidate between support and resistance on a weekly basis.
Weekly chart 2
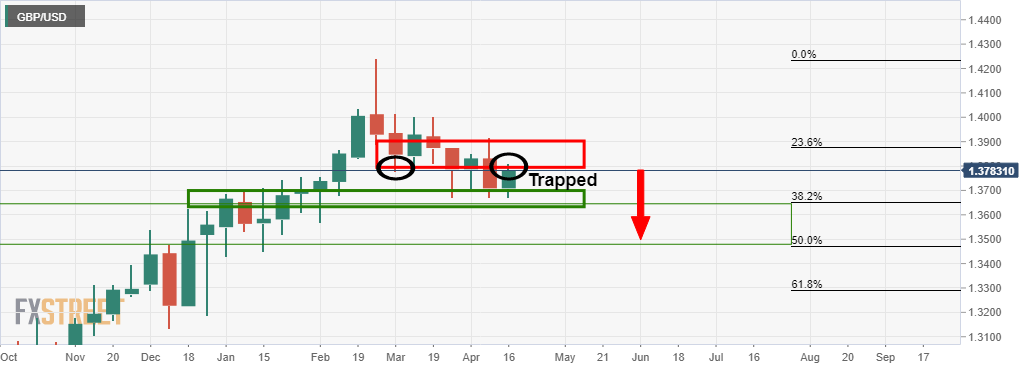
However, a rejection of old support could open the way for a break of current support.
Daily chart
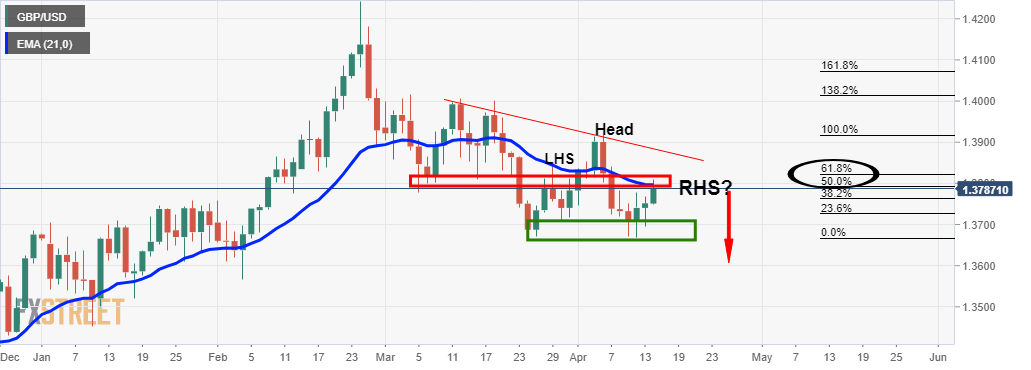
The daily chart offers the prospects of a bearish head and shoulders as well and a rejection of old support will form the right-hand shoulder of the pattern.
