- Silver is in the hands of the bears as it struggles below daily resistance.
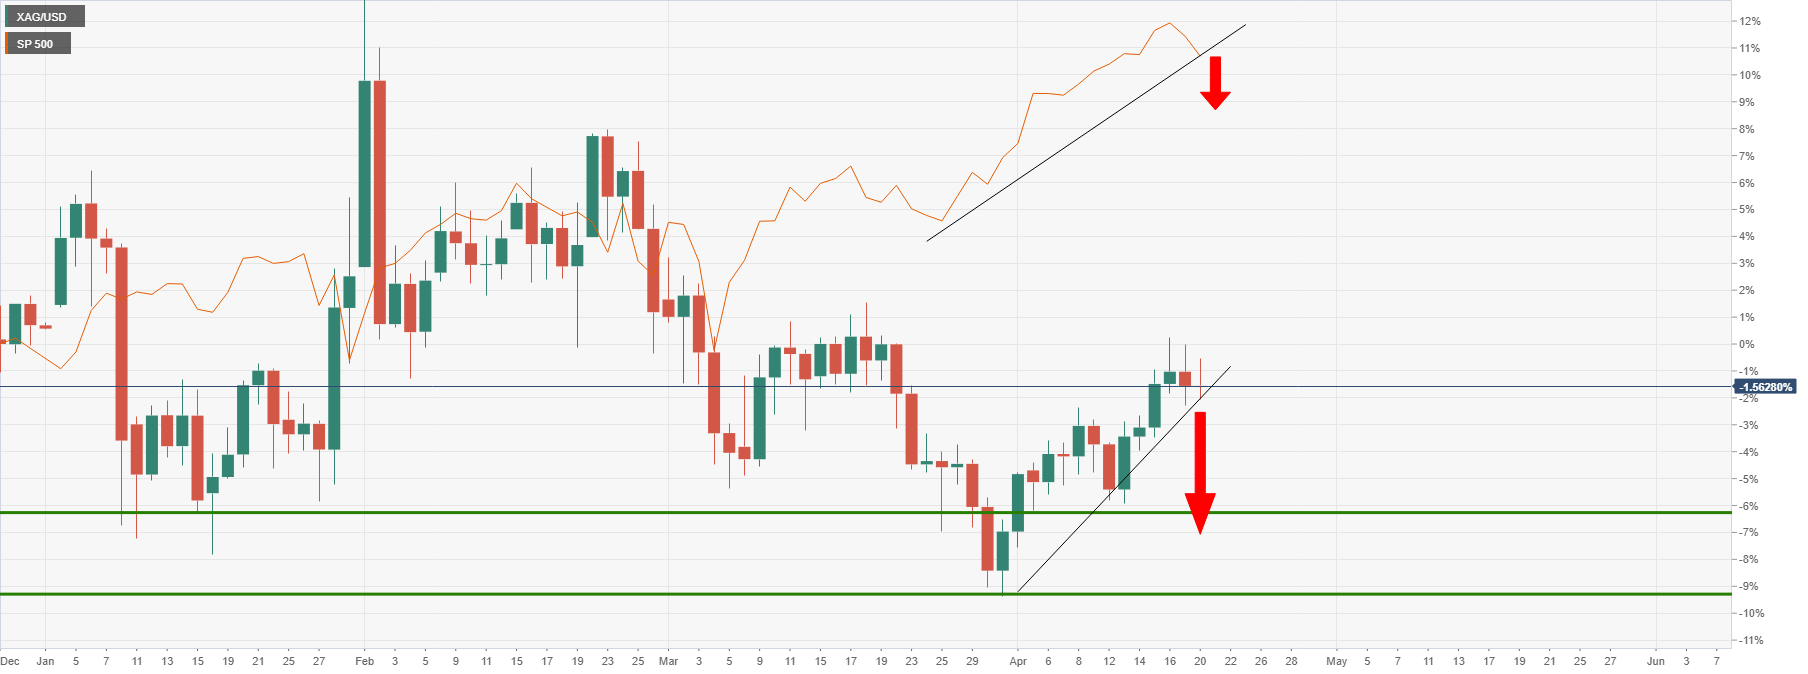
- Positive correlations to the stock market are compelling as the US dollar firms.
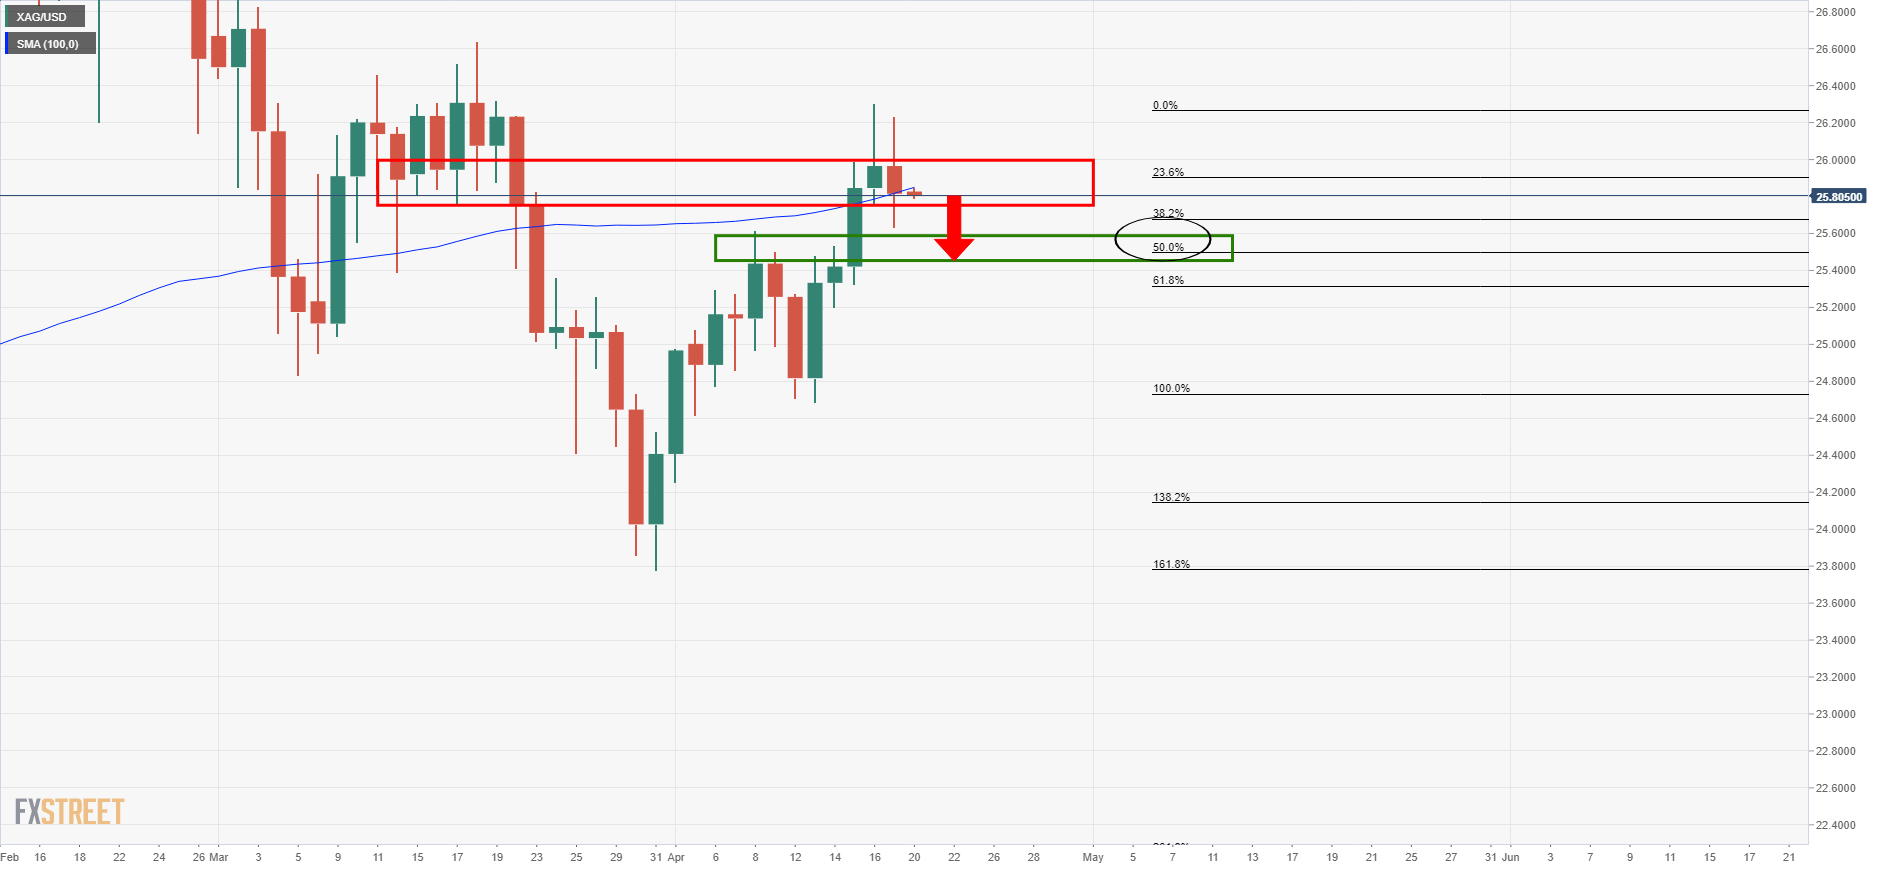
As per the prior analysis, Silver bears taking up the baton towards a 50% mean reversion target, there has been little progress to the downside but the path of least resistance remains with the bears.
Prior analysis, daily chart
Silver prices have stalled at daily resistance and in the day’s move to the downside, it has subsequently formed a new 4-hour resistance at 25.91.
Supply would be anticipated to reemerge there and result in a deeper bearish retracement towards the early April highs and a confluence with the 50% mean reversion level of the latest bullish daily impulse at 25.50.
Live market, 1-hour chart
It’s been a sideways chop since the prior analysis and the price is flat on the day so far.
However, from a longer-term vantage point, the bias is to the upside and given the recent test of the 38.2% Fibonacci on some broker feeds, then there is a possibility that the price can firm at this juncture.
Monthly chart
The price has already tested the monthly support of the W-formation’s neckline and is moving higher.
That being said, the IUS dollar is in the hand of the bulls from critical support which could give rise to a continuation in the downside on the daily chart for silver prices:
DXY attempts to recover as US stocks continue to bleed
The positive correlation to US stocks is also worth noting:
S&P 500 / XAG/USD daily chart


