- AUD/NZD is correcting towards a deep daily 61.8% Fibonacci confluence resistance area.
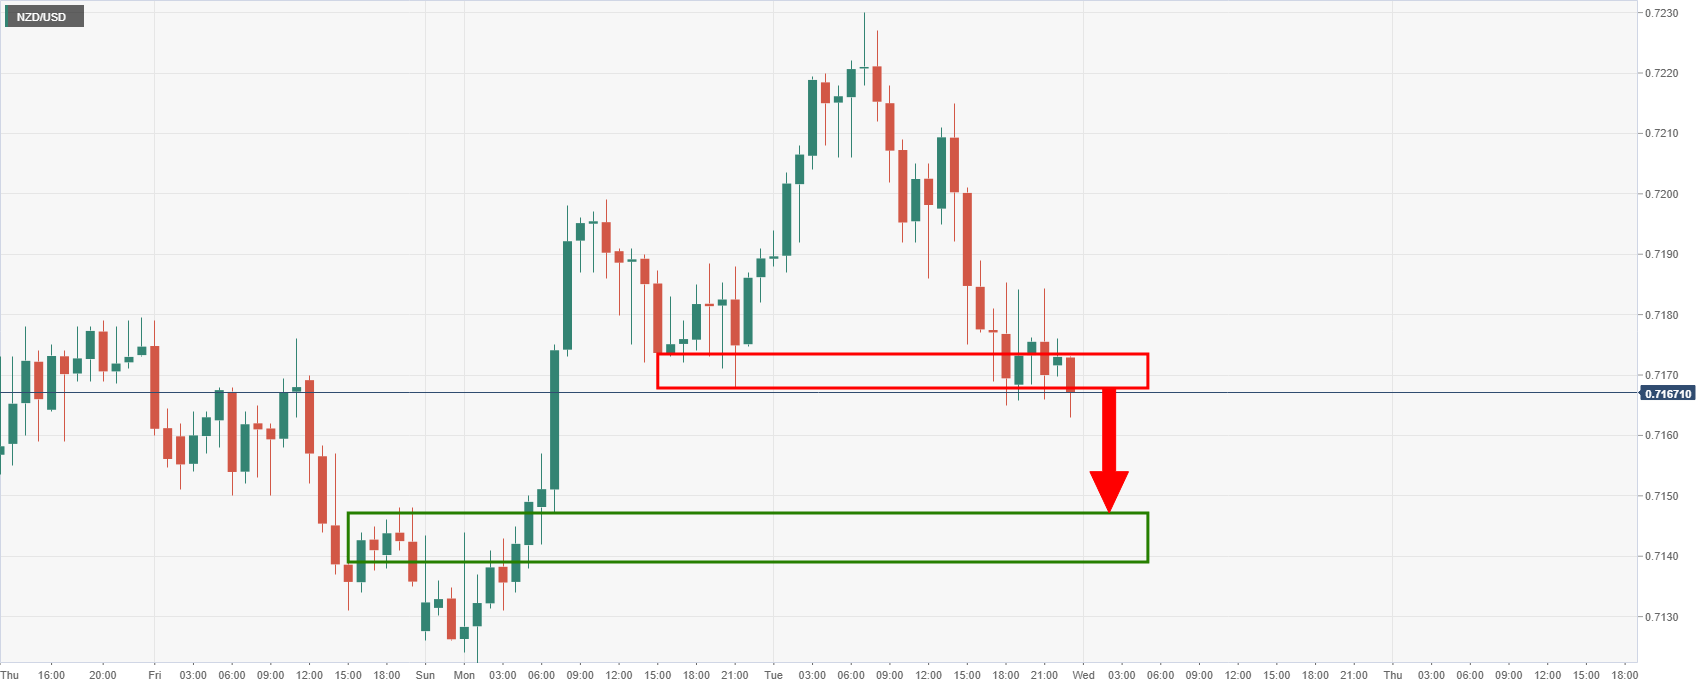
- The 4-hour conditions are reflecting the bid in AUD and the offer in NZD vs the US dollar.
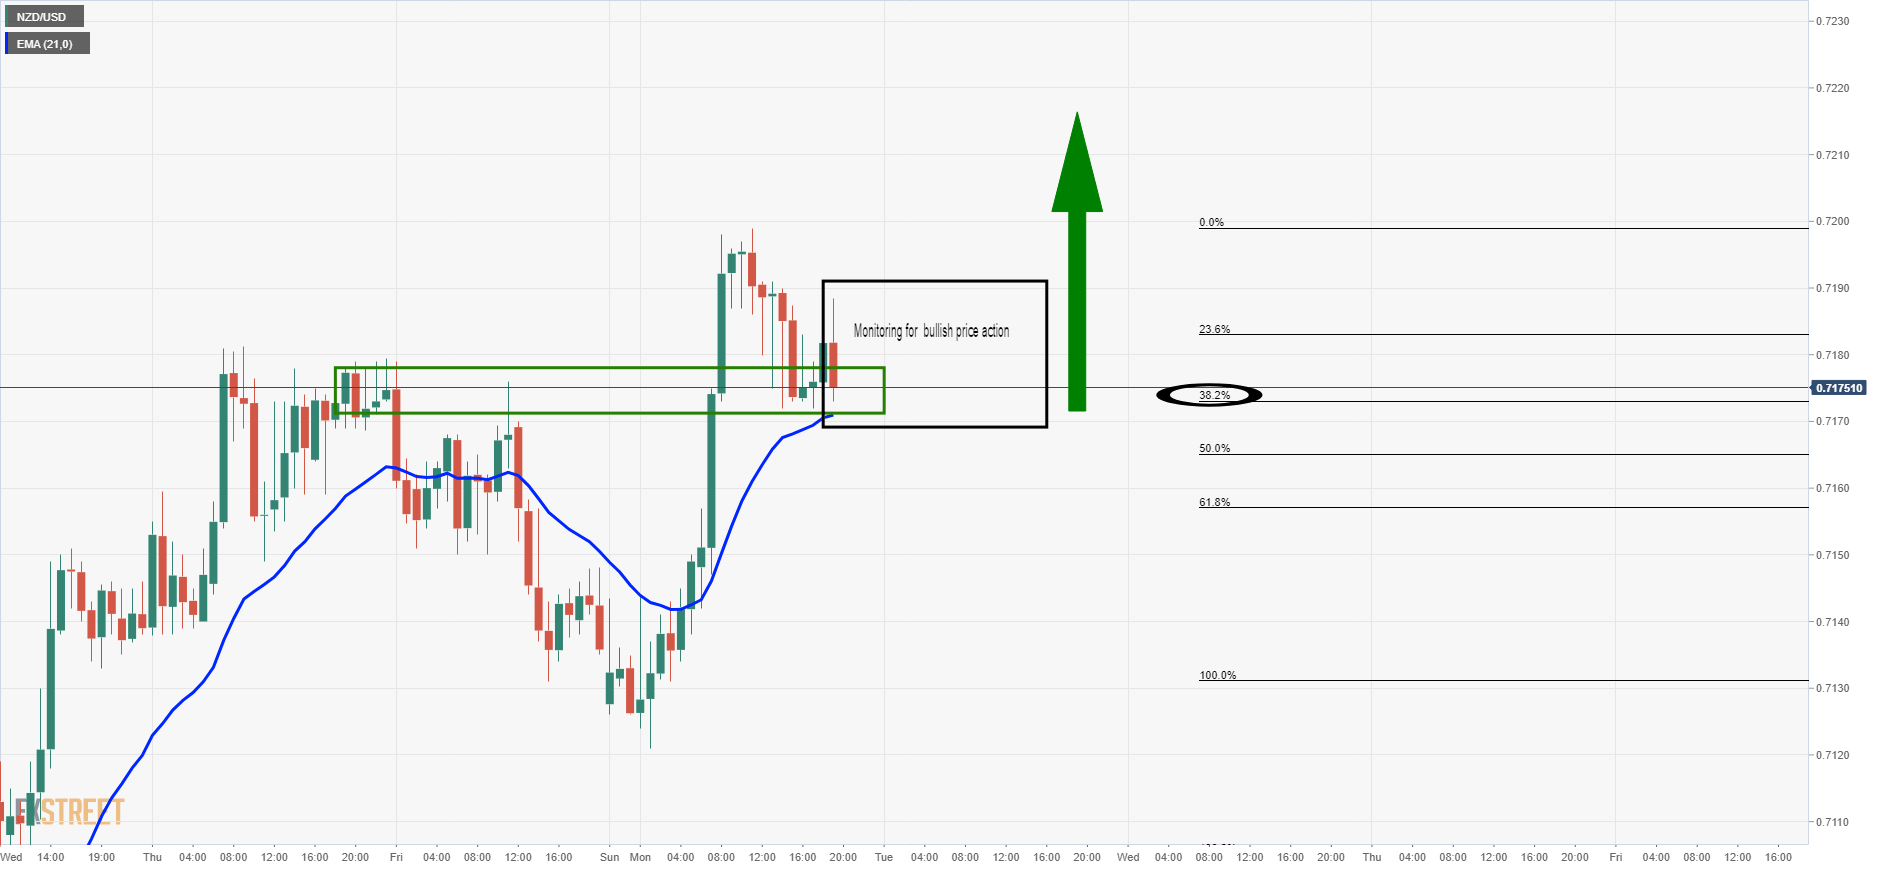
As per the prior analysis, NZD/USD Price Analysis: Bulls defending the 38.2% Fibo support, The kiwi has been a firm contender in the past week so far and but the support is back under pressure following the anticipated surge to the upside:
Prior analysis, NZD/USD, 1-hour chart
So far, there is strong resistance on bullish attempts, but the price is holding at a 38.2% Fibonacci confluence that meets prior resistance structure looking left.
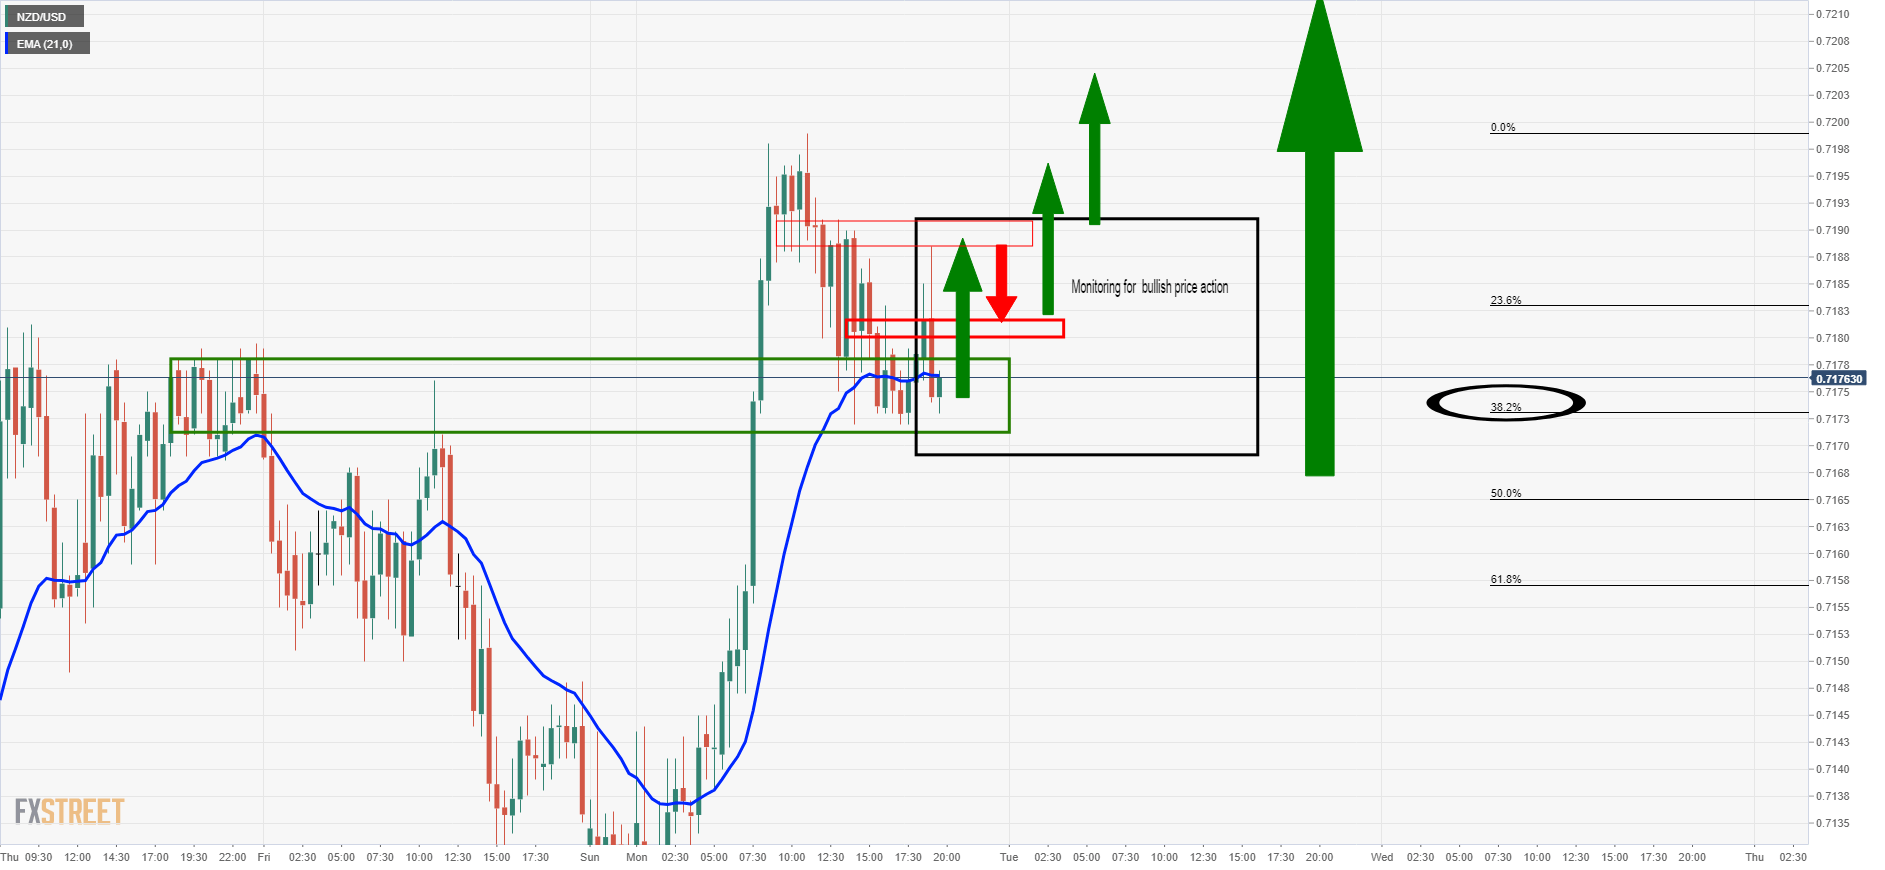
The bulls can continue to monitor for bullish price action and structure on a lower time frame for an optimal entry:
30-min chart
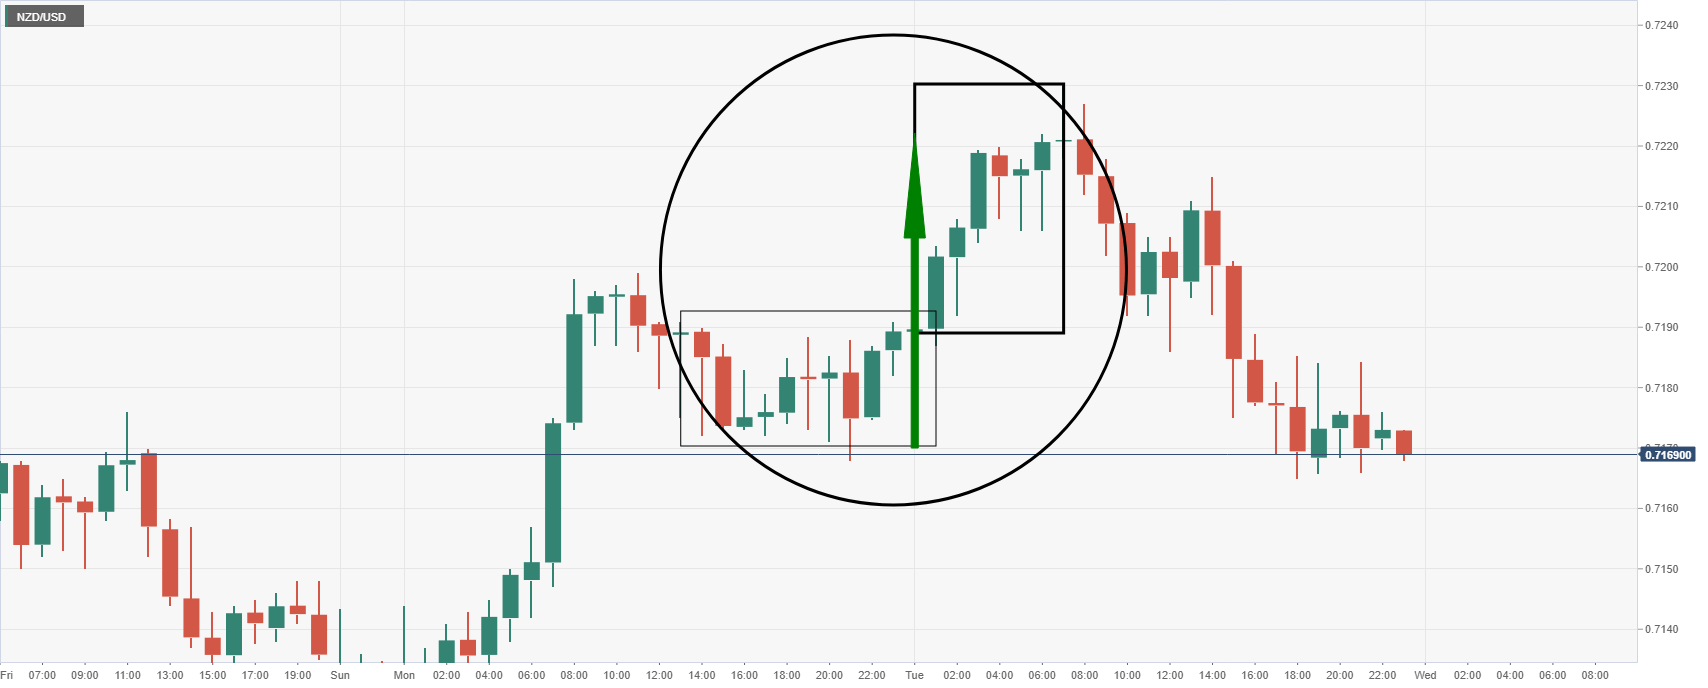
Live 1-hour market, take profit achieved
As illustrated in the hourly chart above, the price went on to make a higher high.
However, the price has since melted back to support and is consolidating the recent volatility.
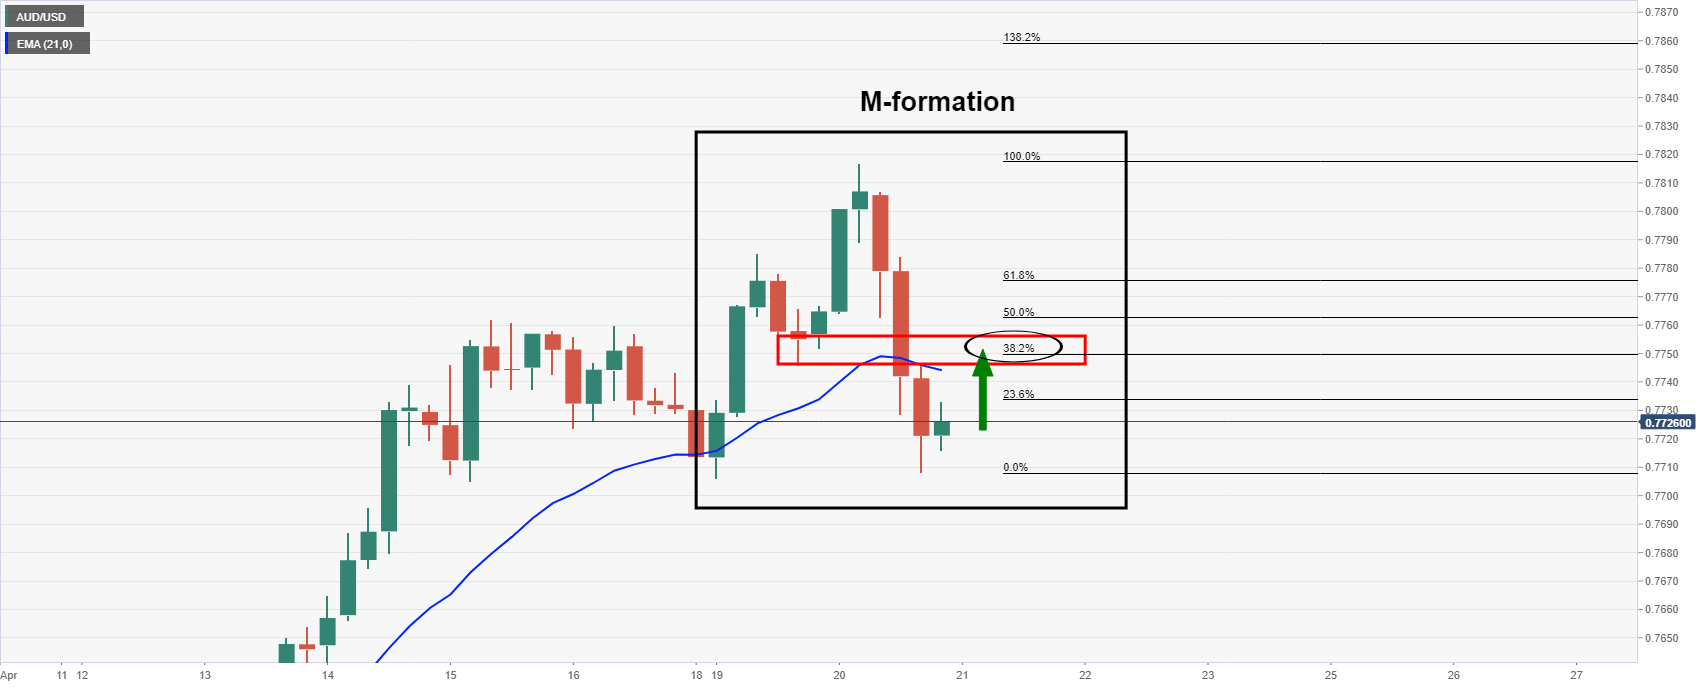
When looking across to the Aussie, there are prospects of an upside correction as follows:
4-hour chart
The M-formation is a bullish pattern that would expect to draw in the bids to test the prior lows and to at least a 38.2% Fibonacci retracement of the range of prior downside’s impulse.
There is also a confluence of the 21-EMA.
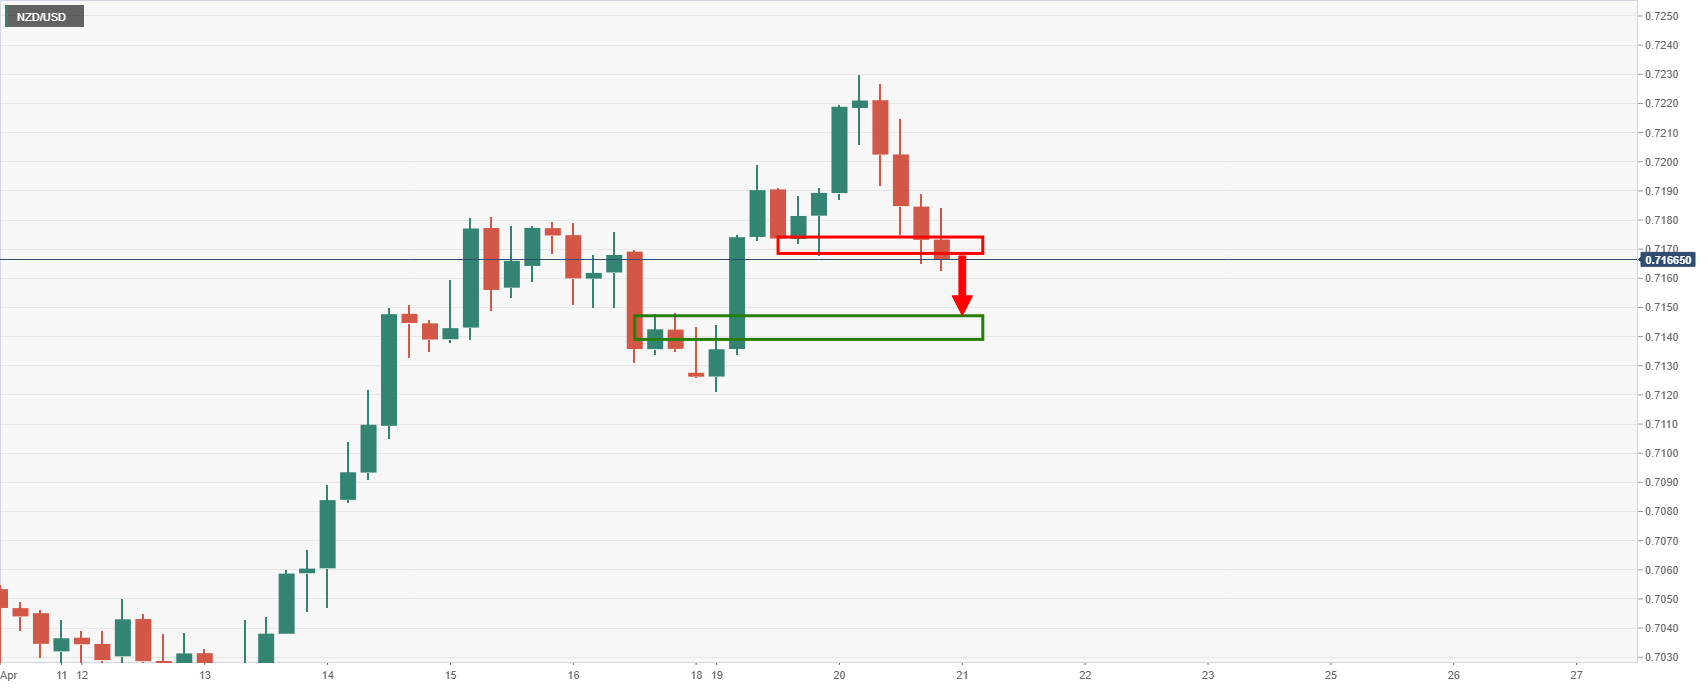
This means that there are prospects of a bid in AUD/NZD with NZD/USD already in decline on the 1 and 4-hour charts:
1-hour chart
4-hour chart
AUD/NZD 4-hour chart
As illustrated, the price is on the verge of an upside correction to test old support and the confluence with a 61.8% Fibonacci retracement level.
According to the daily chart, there are prospects of an even deeper correction:
-637545600002099179.png)
-637545601708662403.png)
