- XPD/USD looks to retest an all-time-highs, as buyers return on Friday.
- Palladium keeps its range within a rising wedge on the 4H chart.
- Upside bias remains intact while the bulls hold above 21-SMA.
Palladium (XPD/USD) is making another run towards the $2,900 mark, having recaptured the $2,850 level after Thursday’s correction.
Price of Palladium
The XPD bulls found solid support at the upward-sloping 21-simple moving average (SMA) at $2,822 on the four-hour chart.
The Relative Strength Index (RSI) inches higher above the central line, suggesting that there is more scope to the upside.
Therefore, a test of the record highs of $2,897 remains on the cards. The $2,900 round number could offer immediate resistance.
Further up, the rising wedge hurdle at $2,924 could challenge the bullish commitments.
Palladium price chart: Four-hour
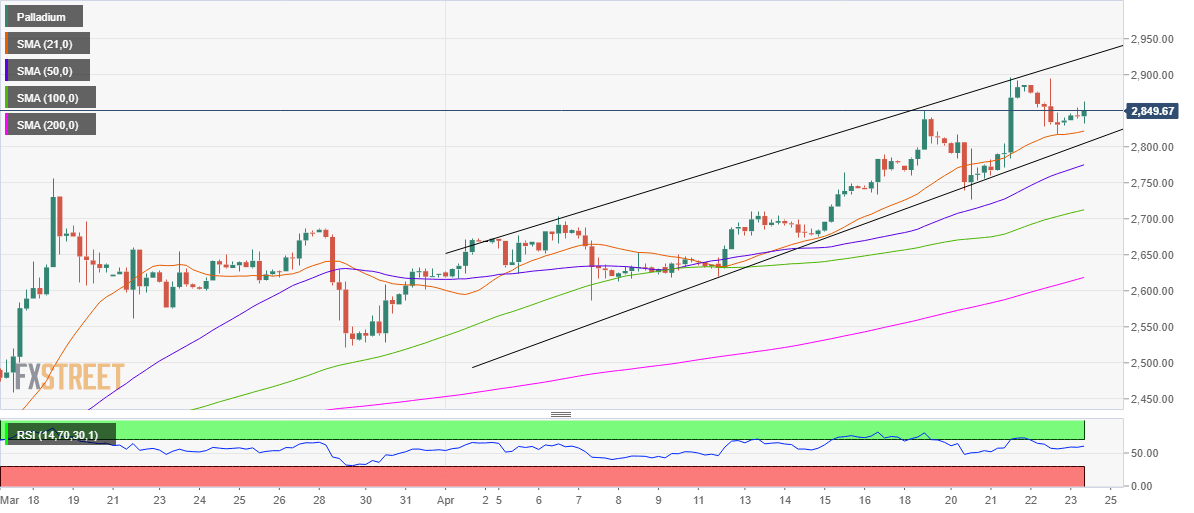
The upside momentum could get negated if the price closes the four-hour candlestick below the 21-SMA support.
The next relevant support is seen at the wedge lower boundary, which is at $1805.
Note that price has been ranging within a rising wedge formation since the start of this month.
