- Gold struggles to extend Monday’s bounce, wavers inside the key area.
- Nine-week-old horizontal support zone adds to the downside filters.
- Late February tops can lure bulls beyond 100-day SMA.
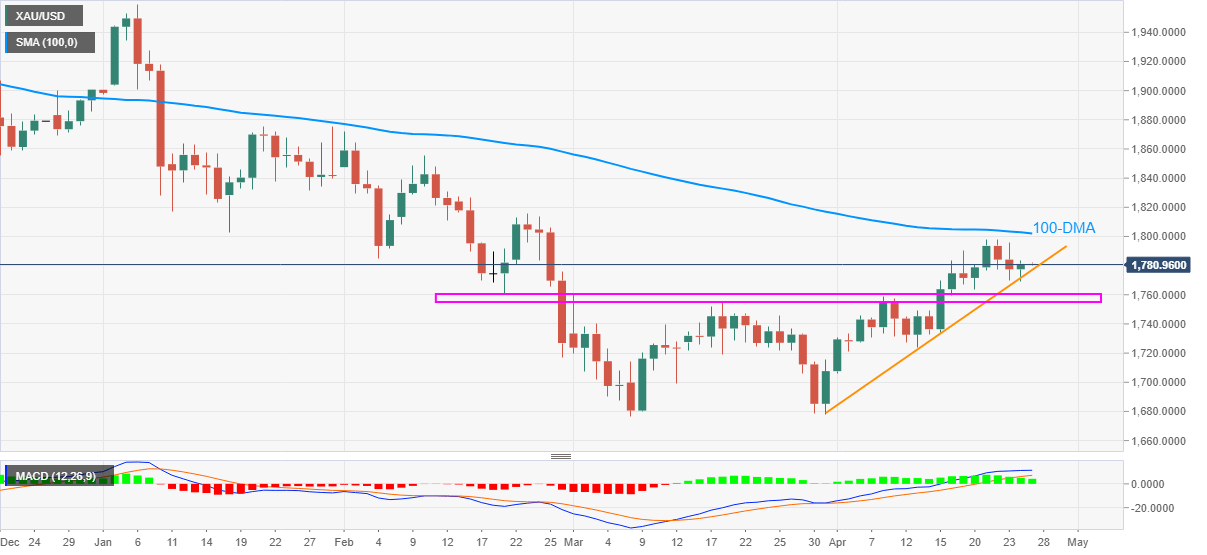
Following its bounce off an ascending support line from March 31, gold remains lackluster around $1,780 amid Tuesday’s Asian session. In doing so, the yellow metal stays depressed below 100-day SMA (100-DMA).
However, bullish MACD and the commodity’s ability to stay beyond the key short-term support line, as well as a crucial horizontal support area comprising multiple levels marked since February 19 keep gold buyers hopeful.
Hence, the bullion’s another run-up towards the $1,800 can’t be ruled out even as the 100-DMA level of $1,802 becomes a tough nut to crack for the gold bulls.
In a case where gold crosses the $1,802 hurdle, February 23 high close to $1,816 should return to the charts.
On the flip side, a daily closing below the stated support line, around $1,777, will revisit the $1,760-55 support area.
Though, a clear downside past-$1,755 will direct gold sellers towards the $1,678-76 region comprising lows marked in March and April.
Gold daily chart
Trend: Sideways
