- GBP/USD rebounds towards 1.3900 amid UK-India trades, risk reset.
- Bull cross and 50-HMA support fuels the renewed uptick in the spot.
- Hourly RSI holds bullish ahead of the UK and US macro updates.
GBP/USD is bouncing back towards the 1.3900 threshold amid a recovery in the risk sentiment, which seemingly caps the pullback in the US dollar.
A potential UK-India trade deal also lifts the sentiment around the pound. British Trade Minister Liz Truss said Tuesday, “we will start talks about a full free trade deal with India in the autumn.”
Traders now await the UK Final Manufacturing PMI and US Factory Orders data for fresh directives.
From a near-term technical perspective, the cable has held on to the 50-hourly moving average (HMA) at 1.3870 so far this Tuesday.
The abovementioned key support once again came to the rescue of GBP bulls, as the major sees a solid bounce.
The bull cross on the hourly chart, as represented by the 21-HMA cutting above the 200-HMA, adds credence to the renewed uptick alongside a bullish Relative Strength Index (RSI).
GBP/USD hourly chart
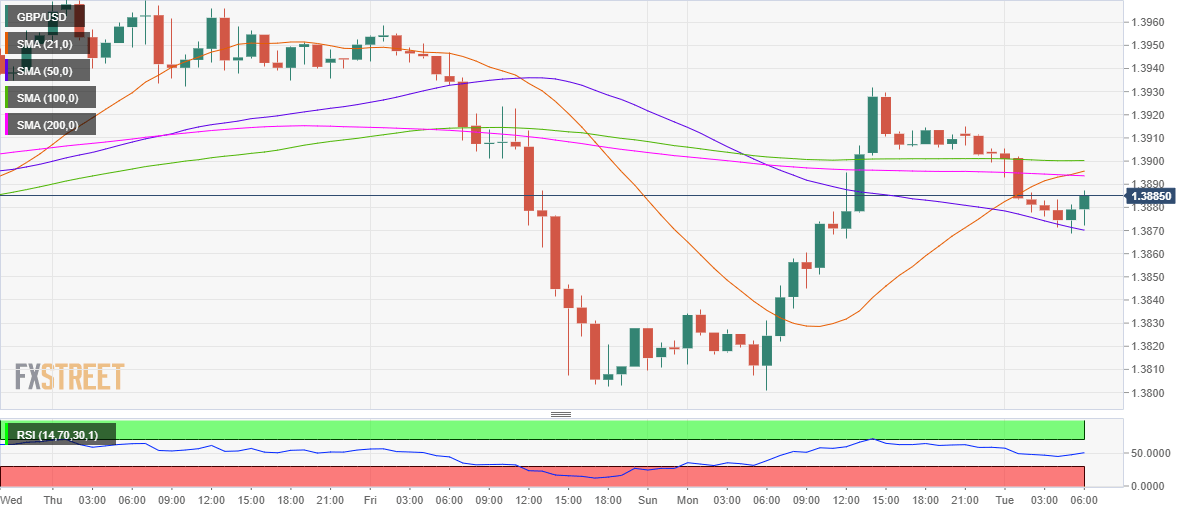
Immediate resistance awaits near 1.3895, the confluence of the 21 and 200-HMAs.
The horizontal 100-HMA at 1.3901 will guard the upside.
Alternatively, a fresh leg towards 1.3850 cannot be ruled out if the 50-HMA support caves in.
Monday’s low at 1.3831 will be next on the sellers’ radars.
GBP/USD additional levels to watch
