- Gold is trapped on the daily time frame and traders are looking for a confirmation bias.
- The bulls are watching for a break of monthly resistance to confirm their bias.
- Bears are yet to fully test the weekly support structure.
As per the prior analysis, ‘Gold Price Analysis: Bulls and bears battle it out at critical resistance,’ the price has indeed found demand again and continues to be a battle between the bulls ad bears at a critical area across the time spectrum of the charts.
For instance, the monthly and weekly charts are somewhat conflicting, whereas the daily is more aligned with a bullish perspective.
The following illustrates that there is something for both the bulls and the bears to take away from a top-down analysis, although swing traders would be prudent to wait for confirmation biases in choppy price action.
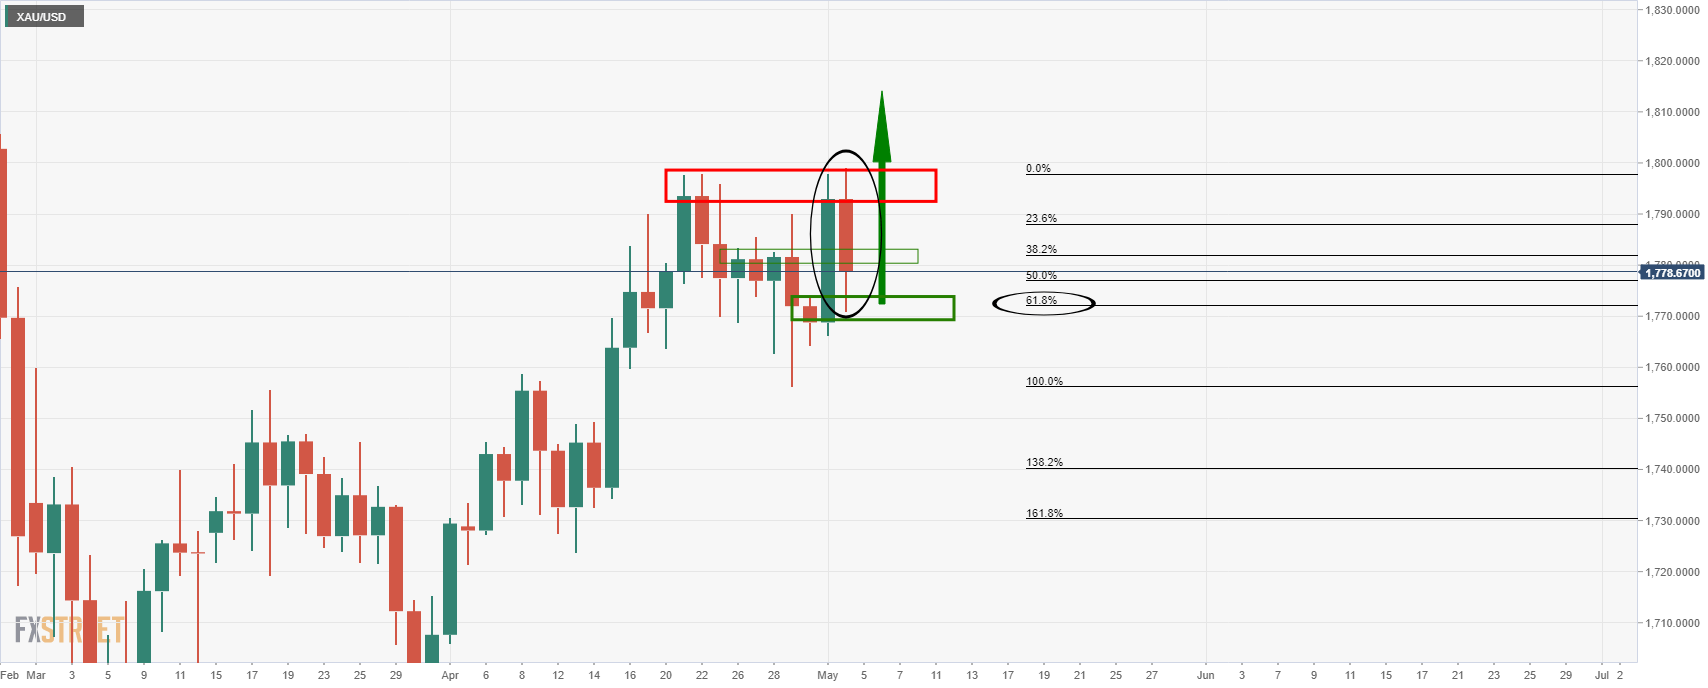
Prior analysis, daily chart
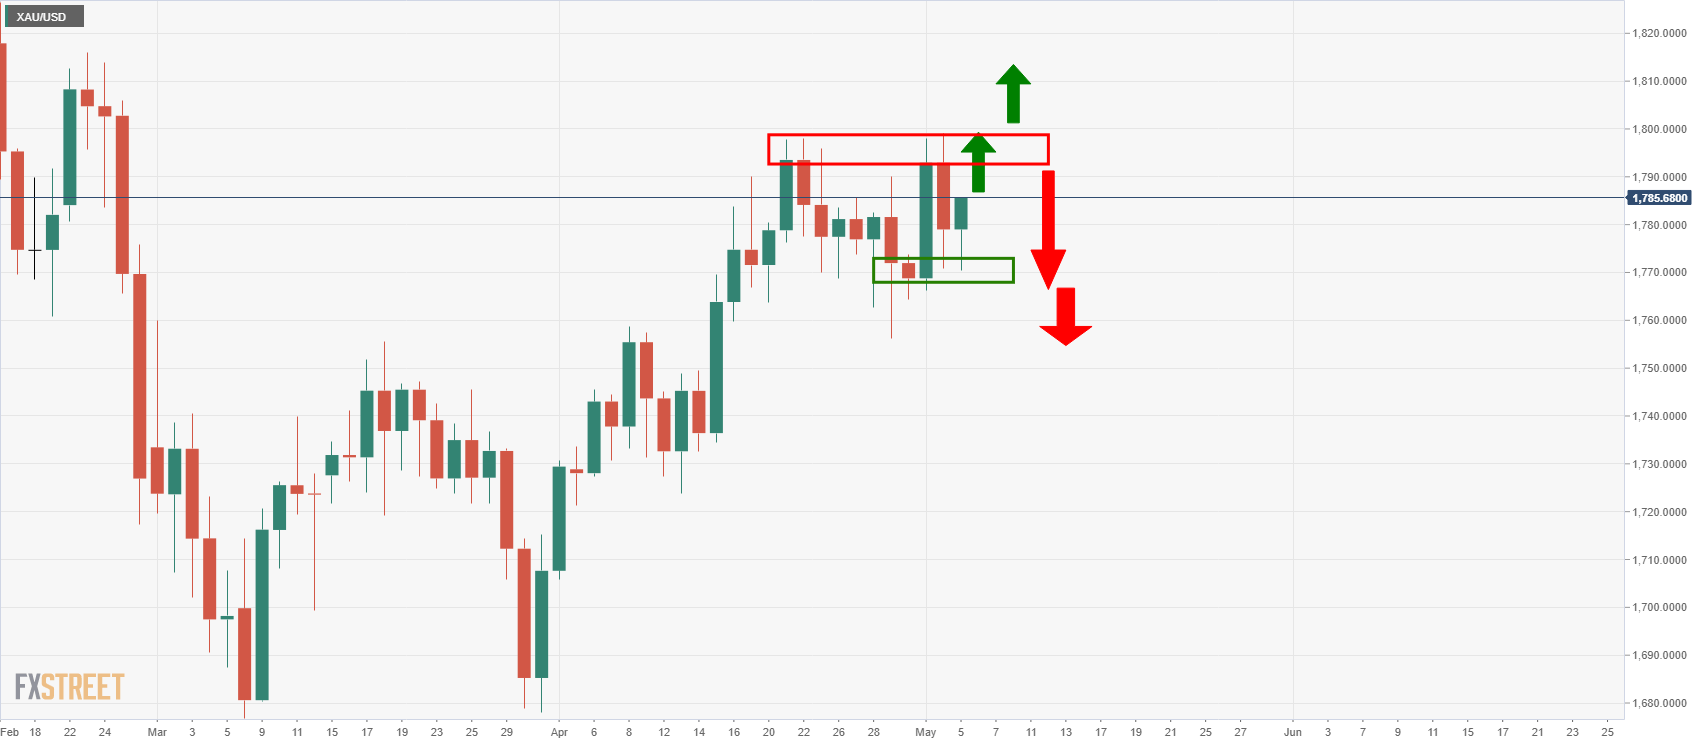
Live market, daily chart
The price action is choppy, respecting support and resistance structures daily.
The current ATR is relatively low, at $4.00, so there is not much prospect of more action in the price on Wednesday, although both the bulls and the bears need a confirmation bias in a break of support/resistance either way.
Meanwhile, the picture is slightly jumbled by the modest test of the 38.2% Fibonacci retracement level and prior resistance structure of the W-formation on the weekly chart.
Bulls would have preferred to see a more aggressive attempt by the bears of the support structure prior to committing more bets on the upside.
The price can still easily return for another attempt at the support structure before an upside continuation.
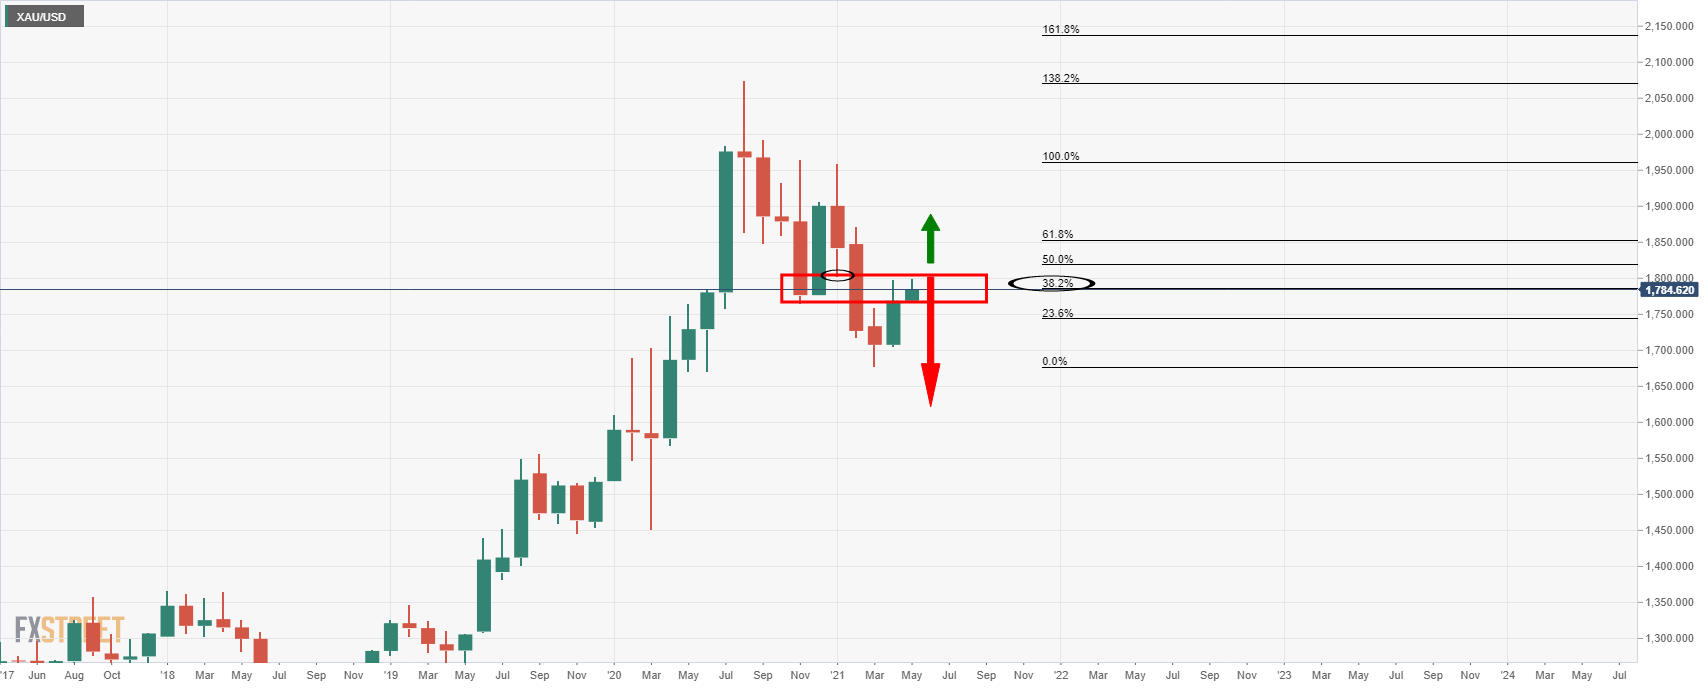
That being said, there is every possibility that the support structure will not hold and give way to bears from a monthly perspective.
Monthly chart
Meanwhile, the monthly chart is bearish below a 38.2% Fibonacci retracement and the confluence of prior support, or bullish above it at this juncture.


