- EUR/JPY is showing bullish intentions on the daily chart.
- Monthly resistance could keep the bulls in check.
EUR/JPY is moving to the upside and testing the monthly resistance zone which is illustrated in the series of charts below.
In a top-down analysis, the bias is to the upside for the meanwhile, but bears will be lurking within the monthly support zone.
Monthly chart
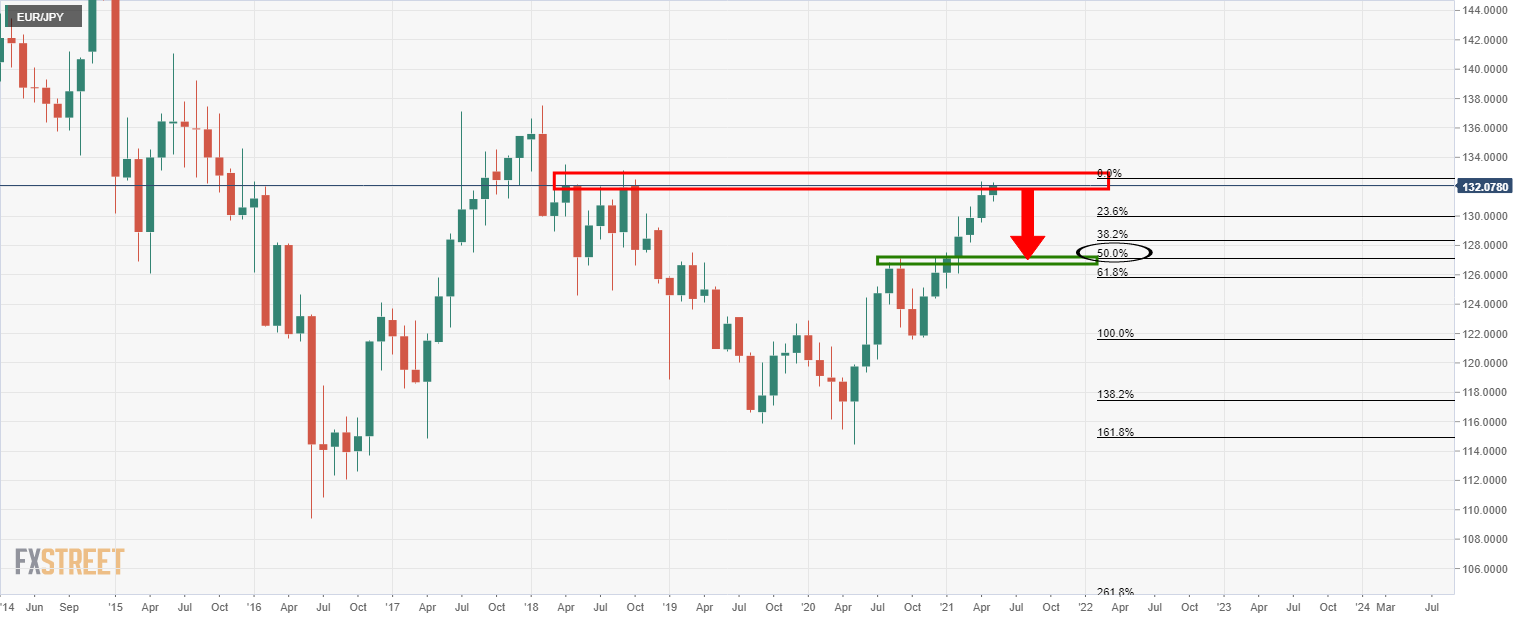
The monthly chart shows that the price is meeting a new supply zone and would be expected to struggle to move much higher without some form of a correction.
Weekly chart
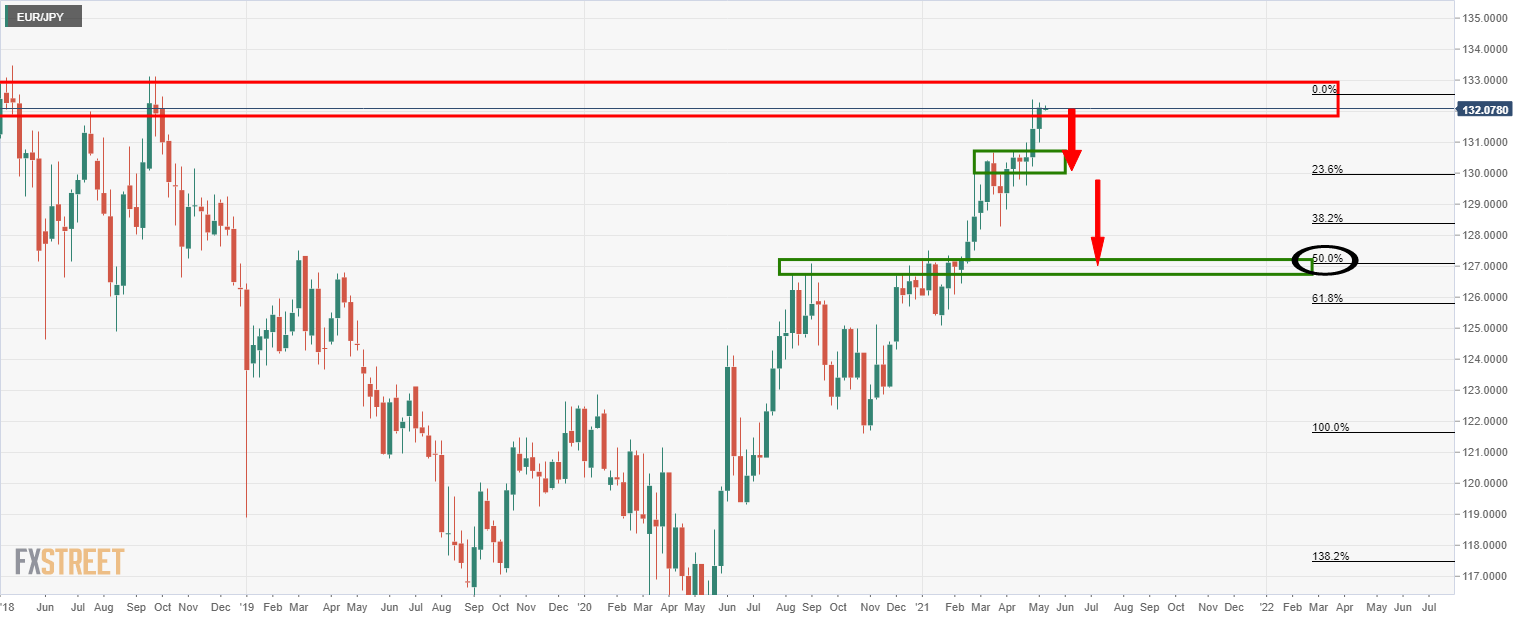
The bulls are chipping away at the resistance area.
If there were to be a monthly correction, the weekly support would need to give out.
Daily chart
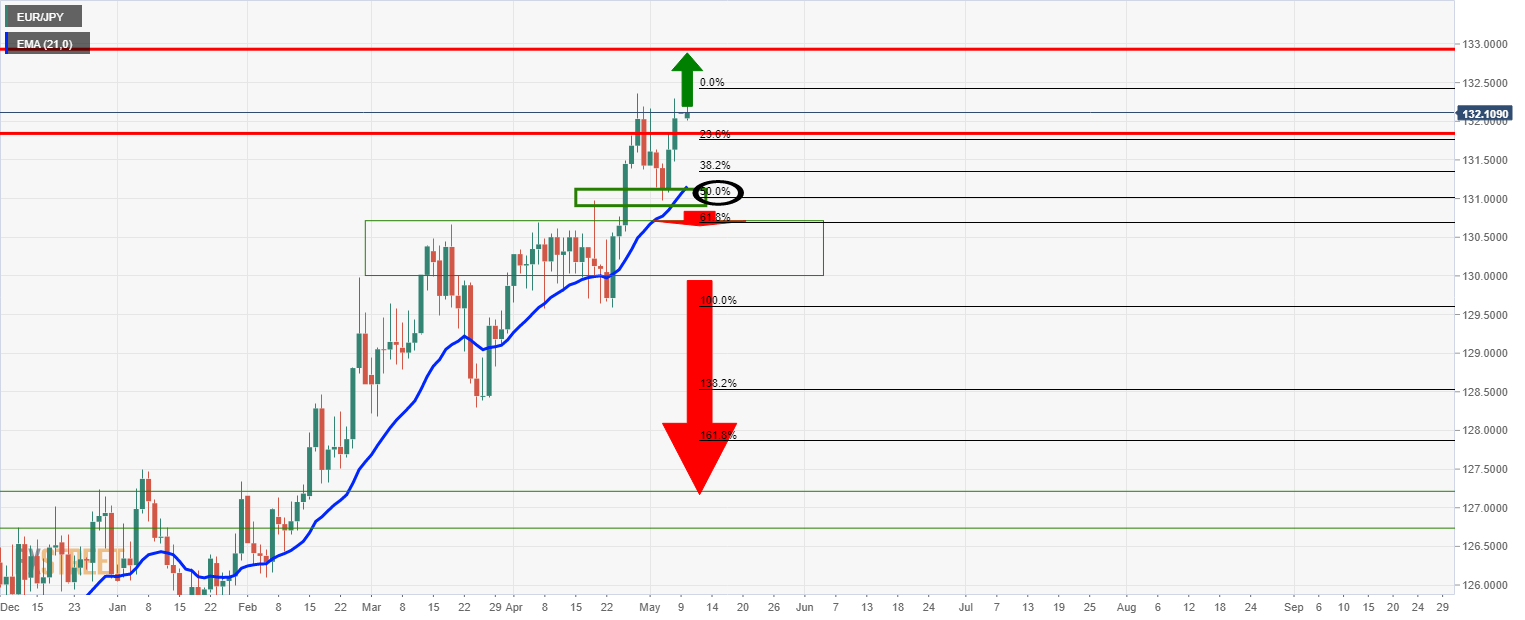
Meanwhile, the daily chart shows the potential for an upside continuation considering the prior deep correction and room to move higher into the month resistance zone.
