- Palladium buyers keep the reins above the key trend line support, battle short-term hurdle.
- 50 and 200-SMA act as extra filters, normal RSI suggests continuation of bull-run.
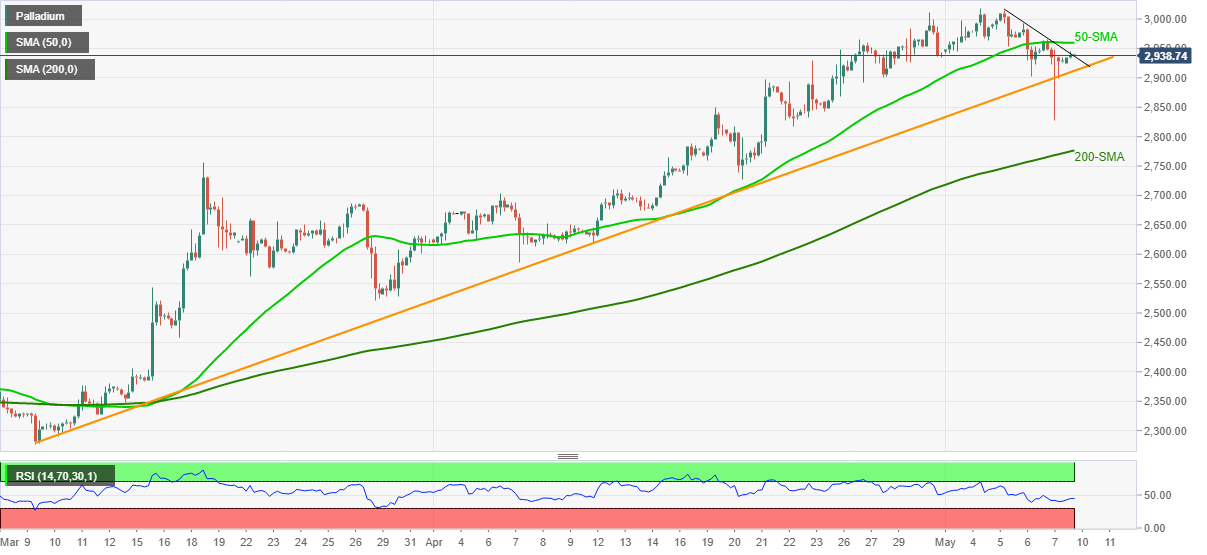
Despite recently struggling with a downward sloping trend line from last Wednesday, palladium (XPD/USD) buyers stay hopeful while flashing 2,936 as a quote, up 0.27% intraday, ahead of Monday’s European session open.
Not only the adjacent resistance line close to $2,937 but the 50-SMA level of $2,959 also tests short-term palladium buyers.
Additionally, the $3,000 psychological magnet and the recent record top, flashed last week, around $3,020, add to the upside filters.
Meanwhile, pullback moves below the stated support line from early March, near $2,910 by the press time, may not hesitate to conquer the $2,800 threshold.
However, 200-SMA and March’s top, respectively around $2,775 and $2,755, could test the palladium bears afterward.
Overall, the bullion is on the north-run but intermediate pullbacks can’t be ruled out.
Palladium four-hour chart
Trend: Bullish
