- DXY keeps the previous day’s corrective pullback from late February lows.
- RSI recovery backs extension of the latest bounce.
- April’s bottom can probe buyers inside short-term bullish chart pattern.
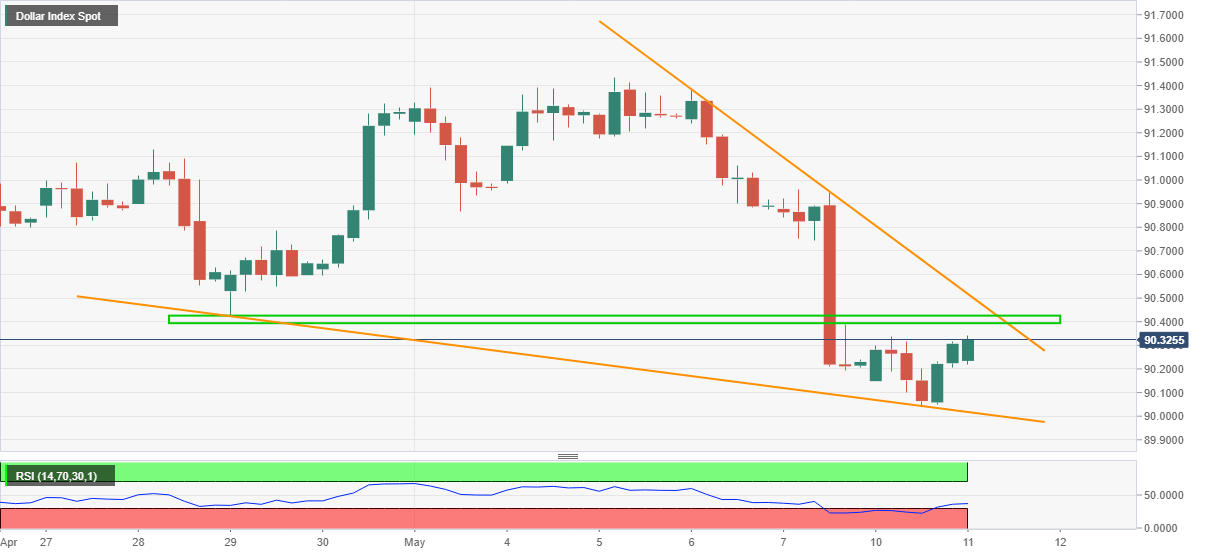
US dollar index (DXY) picks up bids around 90.33, up 0.05% intraday, during its second consecutive daily run-up on early Tuesday. The greenback gauge dropped to the lowest in 10 weeks, before closing the day on a positive side, on Monday.
Given the RSI bounce off oversold territory, DXY run-up may gain momentum but the 90.40-45 area comprising April’s low guards the immediate up-moves.
If at all the US dollar bulls manage to cross the 90.45 hurdle, an eight-day-old falling wedge chart formation gains the market’s attention, which in turn highlights 90.52 as important resistance.
Should the DXY recovery extends beyond 90.52, it becomes capable to attack the monthly top near 91.45.
Meanwhile, the stated formation’s support line near the 90.00 threshold becomes the key to watch during the quote’s fresh downside.
Following that, February’s low of 89.68 and the yearly bottom surrounding 89.20 will be crucial.
DXY four-hour chart
Trend: Further recovery expected

