- DXY struggles for direction around 90.30 on Monday.
- US 10-year yields drift lower and approach the 1.60% mark.
- NY Empire State Index, NAHB Index, TIC Flows next on tap.
The greenback, in terms of the US Dollar Index (DXY), alternates gains with losses around the 90.30 region at the beginning of the trading week.
US Dollar Index looks to yields, data
The index navigates the lower end of the recent range amidst inconclusive risk trends and the persistent corrective downside in yields of the US 10-year reference.
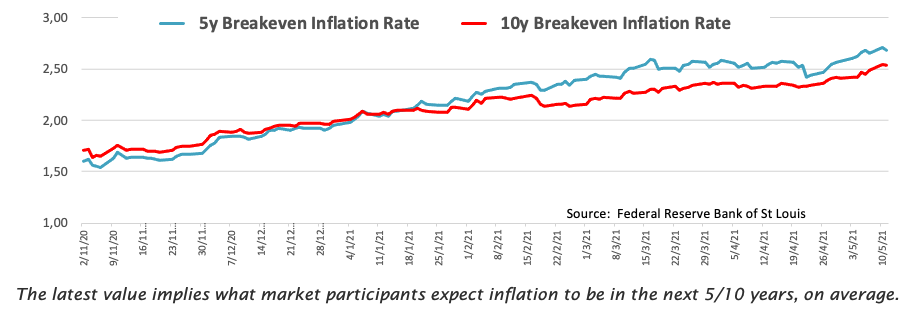
In the meantime, the US economic outperformance plus renewed market chatter regarding higher inflation in the next months (particularly following the publication of April’s CPI las week) appear to contain further selling pressure around the buck for the time being, leaving the 90.00 neighbourhood as quite a tough support for dollar bears.
In the US data space, the NAHB Index will take centre stage later in the NA session seconded by the NY Empire State Index and TIC Flows.
What to look for around USD
The index has fully faded the rally seen during March and returns to the vicinity of the psychological 90.00 neighbourhood despite the reluctance of US yields to grind lower. Looking at the broader scenario, the negative stance on the currency seems to prevail among market participants. This view has been exacerbated following April’s Payrolls, hurting at the same time the sentiment surrounding the imminent full re-opening of the US economy, which is in turn sustained by the unabated strength in domestic fundamentals, the solid vaccine rollout and once again the resurgence of the market chatter regarding an anticipated tapering. The latter comes in despite Fed’s efforts to talk down this scenario, at least for the next months.
Key events in the US this week: NAHB Index (Monday) – Building Permits, Housing Starts (Tuesday) – FOMC Minutes (Wednesday) – Initial Claims, Philly Fed Index (Thursday) – Flash Manufacturing PMI, Existing Home Sales (Friday).
Eminent issues on the back boiler: Biden’s plans to support infrastructure and families, worth nearly $4 trillion. US-China trade conflict under the Biden’s administration. Tapering speculation vs. economic recovery. US real interest rates vs. Europe. Could US fiscal stimulus lead to overheating?
US Dollar Index relevant levels
Now, the index is losing 0.04% at 90.27 and faces the next support at 89.98 (monthly low May 11) followed by 89.68 (monthly low Feb.25) and then 89.20 (2021 low Jan.6). On the other hand, a breakout of 90.90 (weekly high May 11) would open the door to 91.07 (100-day SMA) and finally 91.43 (weekly/monthly high May 5).
