- Gold traders for the week ahead will be looking to the Fed and US Retail Sales in the main.
- XAU/USD tests key trend line ahead of FOMC meeting
- Is gold really an inflation hedge?
Update: Gold (XAU/USD) extends Friday’s losses to the intraday low of $1,871.39, down 0.30% on a day, amid a quiet Asian trading session on Monday. With the rush to risk-safety underpinning the US dollar, gold prices stay on the back foot for the second consecutive day. Although off in China and Australia restricts the market moves, the indecision over the US Federal Reserve’s (Fed) next moves, scheduled for this Wednesday, directs traders toward the greenback. Also weighing on the gold could be the G7 verdict, likely to negatively affect, as well as fears of the Delta variant of the covid.
Read: Fed dot plot seen shifting to 2023 rate liftoff – Bloomberg Survey
It’s worth noting that multiple failures to cross the $1,900 threshold, also having technical importance, directs gold prices further to the south amid a lack of fresh air to recall the buyers.
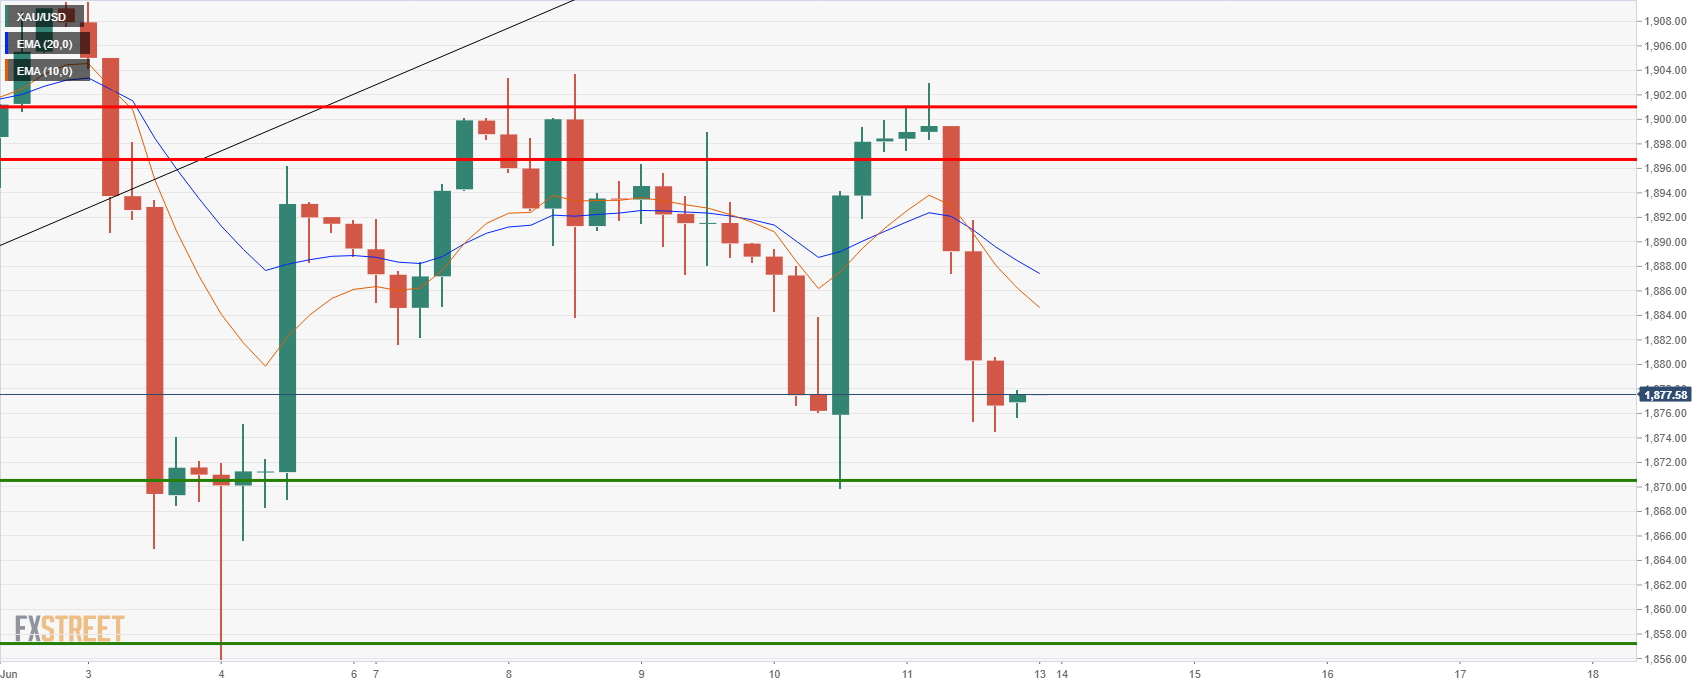
The yellow metal dropped by over 1% vs the US dollar on Friday with XAU/USD falling from a high of $1,903.12 to a low of $1,874.54.
The greenback was stronger. DXY rallied from a low of 89.9570 to a high of 90.6110 ending higher by 0.5% on the day. The move was showing its strongest weekly gain since early May as investors likely positioned for the Federal Reserve meeting this week, covering short positions and searching for carry.
Meanwhile, forex volatility remains at yearly lows:
The dollar has been recently plagued by Federal Reserve’s assertion that high inflation would be temporary.
However, economists see the central bank announcing in August or September a strategy for reducing its massive bond-buying program which is underpinning the greenback to some extent.
For the FOMC event, caution should prevail and the dollar may ultimately lose some support in highly low volatility which tends to benefit the carry trade. However, this too could be challenging for gold as investors search for yield with short covering now also running out of steam.
”Gold’s failure to break $1900/oz despite the surprise non-farm payrolls and CPI inflation prints should catalyze some CTA selling as upside momentum wanes,” analysts at TD Securities argued.
”At the same time, weak price action in breakeven inflation could be pointing to waning inflation-hedging flows, while physical demand has notably weakened amid India’s battle against Covid and with a microstructure pointing to weak Chinese physical demand. In this context, we expect the modest downside flow from CTAs to catalyze a pullback in the yellow metal.”
Gold technical analysis
Gold is bearish for the open while below a 4-hour 10/20 EMA bearish crossover.
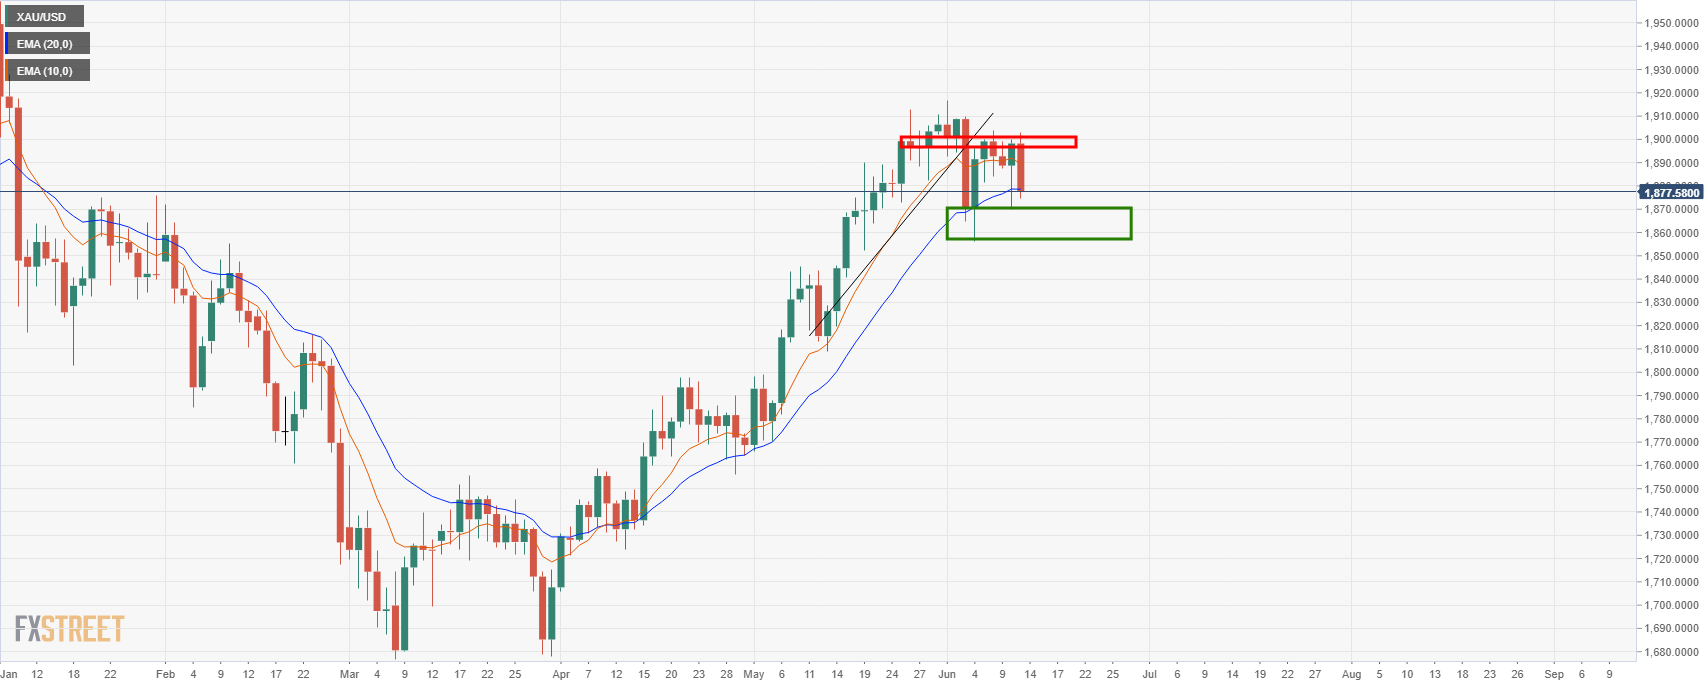
Meanwhile, the price is on track to completing a daily M-formation as it challenges the daily 20 EMA.
There is a confluence of the prior resistance from back in late January near $1,870.
On a test of the area, the upside will be vulnerable to a correction to the prior lows of 1,884/88 in a mean reversion of the bearish impulse.
-637592150082815758.jpeg)


