- The US CPI report showed a decline in inflation that led to an increase in Fed rate cut bets.
- Investors pushed up the chances of a Fed cut in September to 70%.
- Investors will watch inflation figures from Canada.
The USD/CAD weekly forecast points south as bets for a Fed cut increase ahead of more clues on the BoC’s policy outlook.
Ups and downs of USD/CAD
The USD/CAD pair had a bearish week as the dollar fell due to signs of easing inflation. The week started with the US PPI report, which came in higher than expected. However, it had the opposite effect on the dollar, showing investors had priced in such an outcome. On Wednesday, the US CPI report showed a decline in inflation that led to an increase in Fed rate cut expectations. Investors pushed up the chances of a Fed cut in September to 70%. Moreover, they now expect two cuts this year.
–Are you interested in learning more about forex indicators? Check our detailed guide-
Next week’s key events for USD/CAD
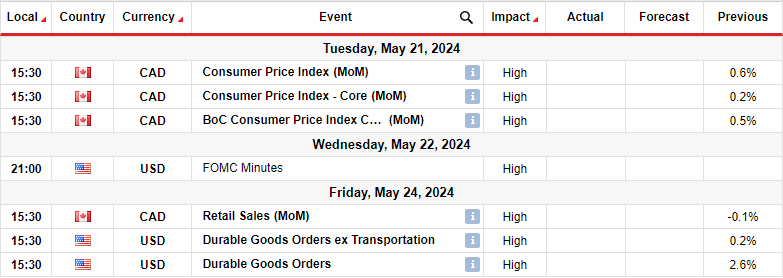
Next week, investors will watch inflation and retail sales figures from Canada. Meanwhile, from the US, they will read through the FOMC meeting minutes and the durable goods orders report. Canada’s inflation report will guide markets on the outlook for BoC rate cuts.
At the moment, investors are confident that the Bank of Canada will cut rates in June. Notably, inflation has continued to ease while the economy has slowed. Therefore, there is more pressure on the BoC to cut rates than any other major central bank. Thus, another downbeat report would solidify bets for a June cut. However, if inflation beats forecasts, it could lead to declining rate cut expectations.
Meanwhile, the FOMC meeting will give clues on policymakers’ bias regarding rate cuts. On the other hand, the durable goods orders will show the state of demand in the economy.
USD/CAD weekly technical forecast: Bears challenge crucial support trendline

On the charts, USD/CAD is at a pivotal support trendline. It trades below the 22-SMA with the RSI under 50, showing bearish sentiment. However, bears can only take full control if the price breaks below the support trendline and start making lower highs and lows.
–Are you interested in learning more about next cryptocurrency to explode? Check our detailed guide-
However, if the shallow bullish trend holds, USD/CAD will bounce off the trendline, break above the 22-SMA, and retest the 1.3800 resistance level. A break above this level would confirm a continuation of the bullish trend. Meanwhile, a break below the trendline would allow bears to revisit the 1.3502 support level.
Looking to trade forex now? Invest at eToro!
68% of retail investor accounts lose money when trading CFDs with this provider. You should consider whether you can afford to take the high risk of losing your money.
