- The dollar has risen since the start of the year due to a decline in Fed rate cut expectations.
- The US economy expanded at a 1.4% rate in the first quarter.
- Tokyo’s core CPI rose 2.1% in June after last month’s 1.9% increase.
The USD/JPY price analysis is bullish as the dollar trades at a 38-year high against the yen ahead of US inflation data. Investors fear a possible intervention as the yen trades at its weakest level since 1986.
–Are you interested in learning more about next crypto to explode? Check our detailed guide-
The dollar has risen since the start of the year due to a decline in Fed rate cut expectations. Currently, it is heading for its second quarter of gains, with the Fed forecasting just one rate cut this year. Meanwhile, investors are expecting at least two. Nevertheless, the outlook will largely depend on incoming data.
Notably, data on Thursday showed the US economy expanded at a 1.4% rate in the first quarter, an increase from the previous 1.3% increase. At the same time, unemployment claims dropped last week from 239K to 233K, indicating labor market strength. Markets are now awaiting the PCE report, which might show inflation easing to 2.6% in May. Lower inflation would raise bets for rate cuts and weaken the dollar. This would give the yen some relief after its recent plunge.
Meanwhile, core inflation in Japan’s capital, Tokyo, increased in June as a weak yen drove import costs higher. The core CPI rose by 2.1% after last month’s 1.9% increase.
Furthermore, data revealed an increase of 2.8% in Japan’s factory output in May. This was a more significant number than the forecast of 2.0%. These reports increased the chances that the Bank of Japan will cut rates in July. Still, this was not enough to stem the yen’s decline.
USD/JPY key events
- US Core PCE Price Index
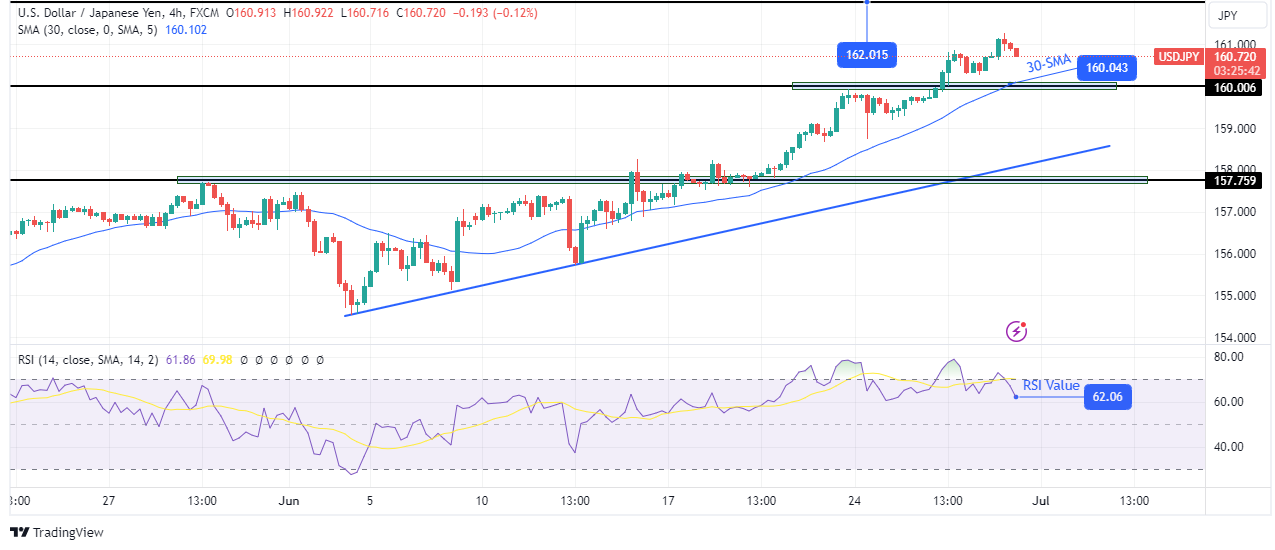
USD/JPY technical price analysis: Bulls eying 162.01 after breaching the 160.00 resistance

On the technical side, the USD/JPY price is on a solid bullish trend that recently broke above the 160.00 critical resistance level. Moreover, the price sits above the 30-SMA, and the RSI is going in and out of the overbought region, showing solid bullish momentum.
–Are you interested in learning more about forex tools? Check our detailed guide-
Furthermore, the uptrend is making such short pullbacks, a sign that bulls are much stronger than bears. Currently, the price has paused and is pulling back. It might retest the 30-SMA support before continuing higher. The next major resistance is at the 16.01 level.
Looking to trade forex now? Invest at eToro!
68% of retail investor accounts lose money when trading CFDs with this provider. You should consider whether you can afford to take the high risk of losing your money.
