- The pound remains one of the best-performing major currencies against the US dollar.
- The Fed is more willing to lower borrowing costs than the Bank of England.
- US GDP figures showed that the economy grew by 3.0%.
The GBP/USD price analysis leans slightly bearish as the pound pulls back from recent highs amid dollar strength. The US dollar firmed on Thursday after data revealed a robust economy despite high interest rates. However, on Friday, investors remained cautious ahead of US inflation data.
-Are you interested in learning about forex live calendar? Click here for details-
The pound remains one of the best-performing major currencies against the US dollar. It has gained 4% so far this year. The recent rally came as markets bet on more rate cuts in the US than in the UK this year. At the same time, the UK economy has recovered from its dip last year, brightening the outlook for the future.
Recent policymakers’ remarks at the Jackson Hole Symposium revealed that the Fed was more willing to lower borrowing costs than the Bank of England. At the same time, market expectations point to a total of 100 bps cuts by the Fed and 65 bps by the BoE.
However, this outlook could keep changing with incoming data. Experts believe the pound is vulnerable because any changes could sharply reverse the trend.
On Thursday, GBP/USD fell as the dollar gained after better-than-expected US economic data. GDP figures showed that the economy grew by 3.0%, above estimates of 2.8%. These figures erased fears of a recession and rekindled hopes of a soft landing by the Fed.
Meanwhile, jobless claims came in lower than expected, revealing a stable labor market. Market participants are now watching the core PCE report for more clues on the outlook for rate cuts.
GBP/USD key events today
- US Core PCE Price Index m/m
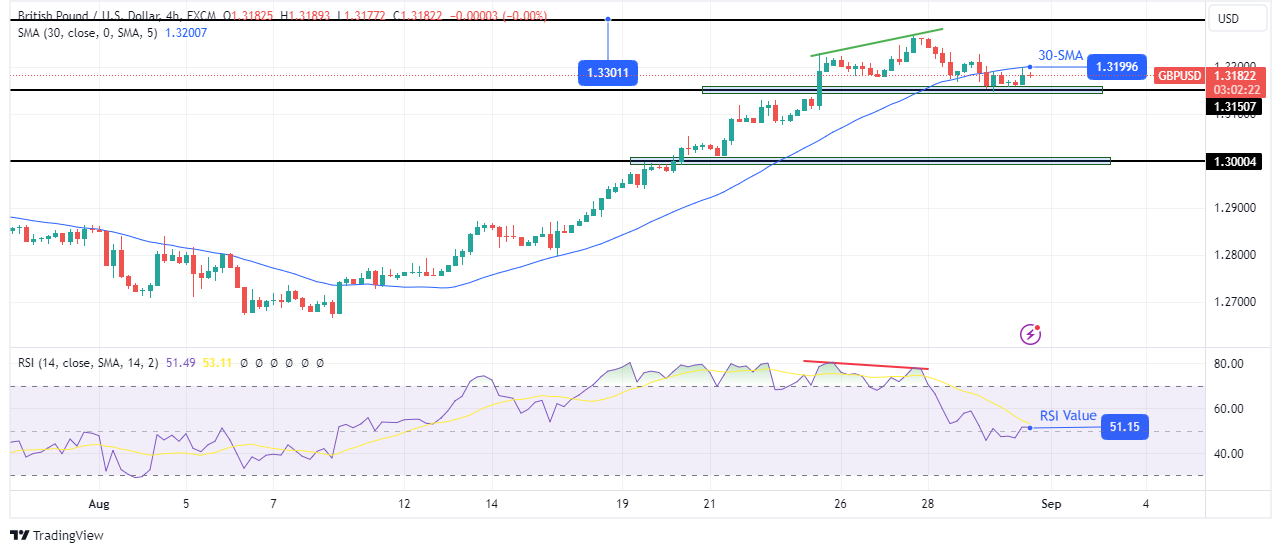
GBP/USD technical price analysis: Battling below 30-SMA

On the technical side, the GBP/USD price has fallen below the 30-SMA, indicating a possible reversal. However, the RSI remains slightly above 50, showing bulls are still fighting for control. The price changed direction after a bearish RSI divergence signaled weakness in the bullish trend.
-Are you interested in learning about forex signals? Click here for details-
However, bears found strong support at the 1.3150 level. This allowed the price to climb and retest the recently broken SMA. If bears remain in charge, the price will make a new low below 1.3150. On the other hand, if bulls return stronger, GBP/USD will break above the SMA.
Looking to trade forex now? Invest at eToro!
68% of retail investor accounts lose money when trading CFDs with this provider. You should consider whether you can afford to take the high risk of losing your money.
