- The USD/CAD price analysis shows strength in the Canadian dollar.
- Economists are predicting a 0.1% decrease in Canada’s inflation.
- Market participants are watching fiscal developments in the US.
The USD/CAD price analysis shows strength in the Canadian dollar ahead of crucial inflation figures from Canada. Meanwhile, the dollar remained fragile after a credit rating downgrade for the US government. At the same time, market participants are on edge ahead of a vote on Trump’s tax cuts bill.
–Are you interested in learning more about buying NFT tokens? Check our detailed guide-
The loonie was strong on Tuesday as all eyes focused on Canada’s inflation report. The last reading revealed a 0.3% increase in inflation. This time, economists are predicting a 0.1% decrease in inflation. A softer-than-expected number will increase pressure on the Bank of Canada to lower borrowing costs, hurting the loonie. On the other hand, an upbeat report would further strengthen the Canadian dollar.
Meanwhile, market participants are watching fiscal developments in the US. Lawmakers will soon vote on a tax cuts bill that could cause volatility in the financial markets. On Monday, Moody’s downgraded the US government’s credit rating due to its growing debt. If Trump’s bill passes, it will further increase the debt burden, hurting investor confidence in US assets.
At the same time, market participants are waiting for more trade deals with the US. However, progress has stalled since the trade truce between the US and China.
USD/CAD key events today
- Canada CPI m/m
- Canada median CPI y/y
- Canada trimmed CPI y/y
USD/CAD technical price analysis: Bears gear up for a triangle breakout
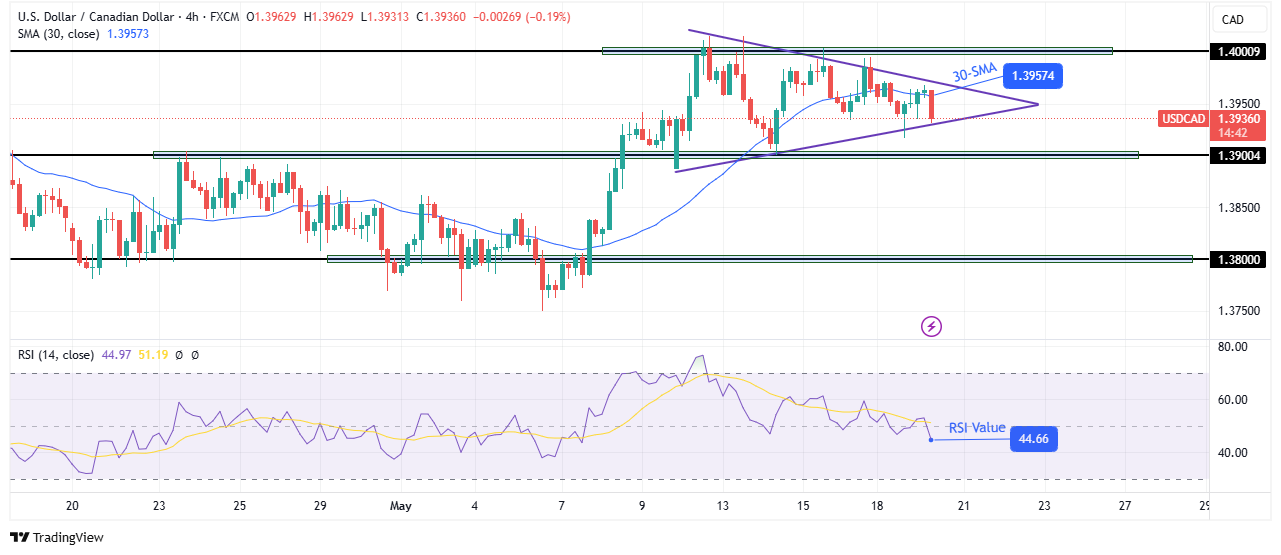
On the technical side, the USD/CAD price trades below the 30-SMA, with the RSI under 50. This suggests a bearish bias. However, on a larger scale, the price is caught in a triangle pattern between the 1.3900 support and the 1.4000 resistance levels.
–Are you interested in learning more about forex robots? Check our detailed guide-
Initially, the price made an impulsive bullish move that paused at the 1.4000 key psychological level. It then entered a corrective move that presented itself as a triangle pattern. Currently, bears are in the lead within the triangle. Therefore, they might try to break out of the pattern.
Still, bears would have to break below the 1.3900 key support to confirm a new direction. Otherwise, bulls will return to retest the 1.4000 key resistance. A break above this level would confirm a continuation of the previous uptrend.
Looking to trade forex now? Invest at eToro!
68% of retail investor accounts lose money when trading CFDs with this provider. You should consider whether you can afford to take the high risk of losing your money.
