- The gold forecast remains broadly bullish with a few corrective jitters due to the ceasefire.
- The Fed Chair’s wait-and-watch policy weighs on gold’s uptrend.
- Market participants are eyeing key US data and the second round of Powell’s testimony.
Gold prices are consolidating above the $3,300 mark after retreating to a 2-week low earlier this week. Although the Israel-Iran ceasefire has alleviated some geopolitical concerns, the durability of the peace remains uncertain. Moreover, shifting odds for US monetary policy continue to keep market participants on their toes.
–Are you interested in learning more about the next cryptocurrency to explode? Check our detailed guide-
The initial optimism after President Trump’s announcement of a “complete and total ceasefire” prompted risk-on flows and pressured safe-haven assets, including gold. However, conflicting developments and missile launches from both sides have cast doubts on the stability of the ceasefire. The geopolitical risk premium may keep the yellow metal supported despite softening demand for safe-haven assets.
On the other hand, the US dollar attempted a significant recovery on the back of Fed Chair Powell’s hawkish remarks. In his testimony to Congress, Powell warned that tariffs may reignite inflation, and the Fed is not in a hurry to cut the rates. Despite this, the markets retain their dovish expectations, with futures pricing a 50-bps cut by the end of 2025 and a 20% chance of a move as early as July.
Gold has been sensitive to these shifting expectations of monetary policy. Lower interest rates increase the demand for non-yielding assets, such as gold, due to a lower opportunity cost of holding. Now, traders await the second round of Powell’s testimony and critical U.S. economic data, including Q1 GDP and the Core PCE Index. Gold’s next meaningful move depends on these factors.
Gold Technical Forecast: Mild Bearish Pressure Near 200-SMA
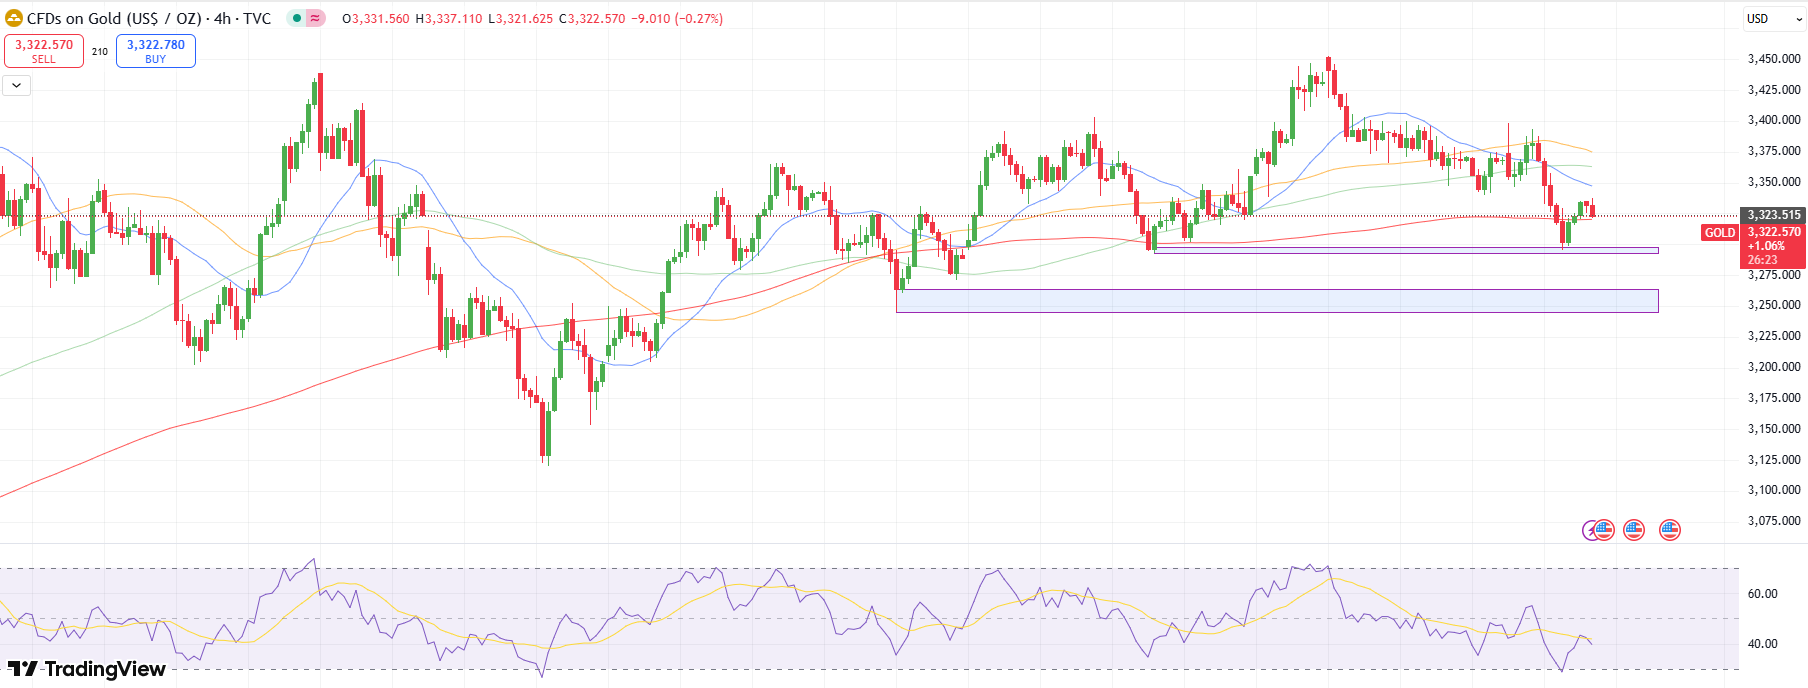
The gold price found decent support under the $3,300 level and bounced back. The price managed to move beyond the 200-period SMA on the 4-hour chart. However, it still lies well below the 20-period and 50-period SMAs. The selling pressure has not yet been elevated. A move below the $3,300 support may drive the price towards the next support zone at $3,250. The RSI level under 50.0 also supports a mildly bearish view.
–Are you interested in learning more about forex indicators? Check our detailed guide-
Alternatively, a sustained move above $3,350 may prompt an intense bullish action, leading to $3,400, followed by $3,450, and ultimately the all-time highs around $3,500.
Looking to trade forex now? Invest at eToro!
68% of retail investor accounts lose money when trading CFDs with this provider. You should consider whether you can afford to take the high risk of losing your money.
