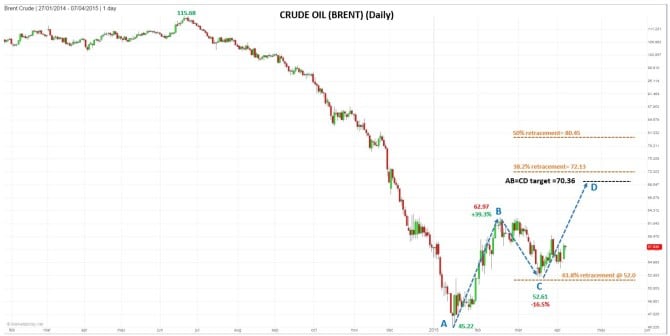
Brent Crude looks to have started a second leg up off the January bottom of 45.22, indicating Brent has a good chance of heading higher from here. A decisive drop below the most recent swing low at 52.61 changes the bullish scenario shown in the below daily chart.
Weekly Chart
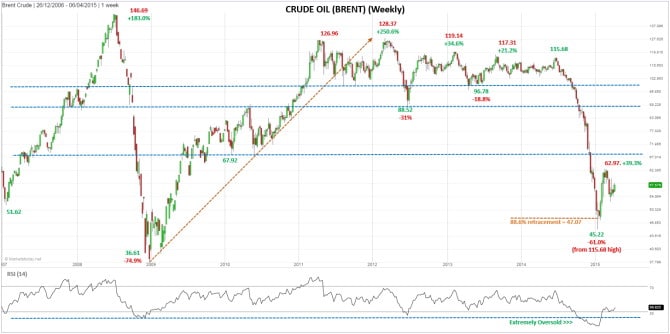
“¢ Most recent 45.22 January low completed a 61% decline from the 115.68 June 2014 peak (over seven months), and a 64.8% drop from the 2012 peak of 128.37.
“¢ Just prior to the low Brent completed a 88.6% Fibonacci retracement – at 47.07, of the three-year 250.6% rally that peaked at 128.37 in February 2012.
“¢ RSI on a weekly basis was extremely oversold at the January bottom – the most in at least 10 years
Bullish signs:
“¢ January low was followed by 39.3% rally
“¢ Subsequent retracement hit a low of 52.61, almost reaching the 61.8% retracement at 52, and bouncing
“¢ Next target for Brent is 70.36, the 100% completion of an AB:CD move off the January bottom
“¢ Higher price levels to watch are:
o 72.13 : 38.2% retracement of prior seven-month decline
o 75.15 : CD leg = 127.2% Fib extension of AB leg
o 80.45 : 50% retracement
o 81.33 : CD leg = 161.8% Fib extension of AB leg
Guest post by Mr. Bruce Powers of MarketsToday


