- Brent oil is currently trading at $74.05 per barrel, having hit a high of $74.70 yesterday. That was the highest level since Nov. 1.
- The rally seems to have stalled with signs of indecision on the daily chart – Brent created a doji candle yesterday.
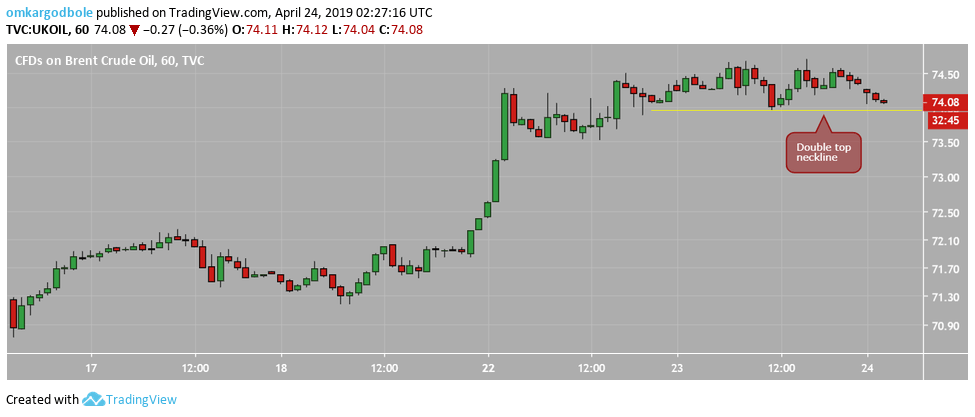
- Further, on the hourly chart, the black gold seems to be creating a double top pattern with the neckline support at $73.96.
- Acceptance below that neckline support would confirm a double top breakdown and create room for a deeper pullback to $73.22 (target as per the measured move method).
- A daily close below $74.00 would validate yesterday’s doji candle and neutralize the immediate bullish outlook.
Hourly chart
Trend: Minor correction possible
Pivot points
