- Brent oil risks falling below the 50-day moving average.
- A break above Monday’s high of $71.53 is needed to revive the bullish outlook.
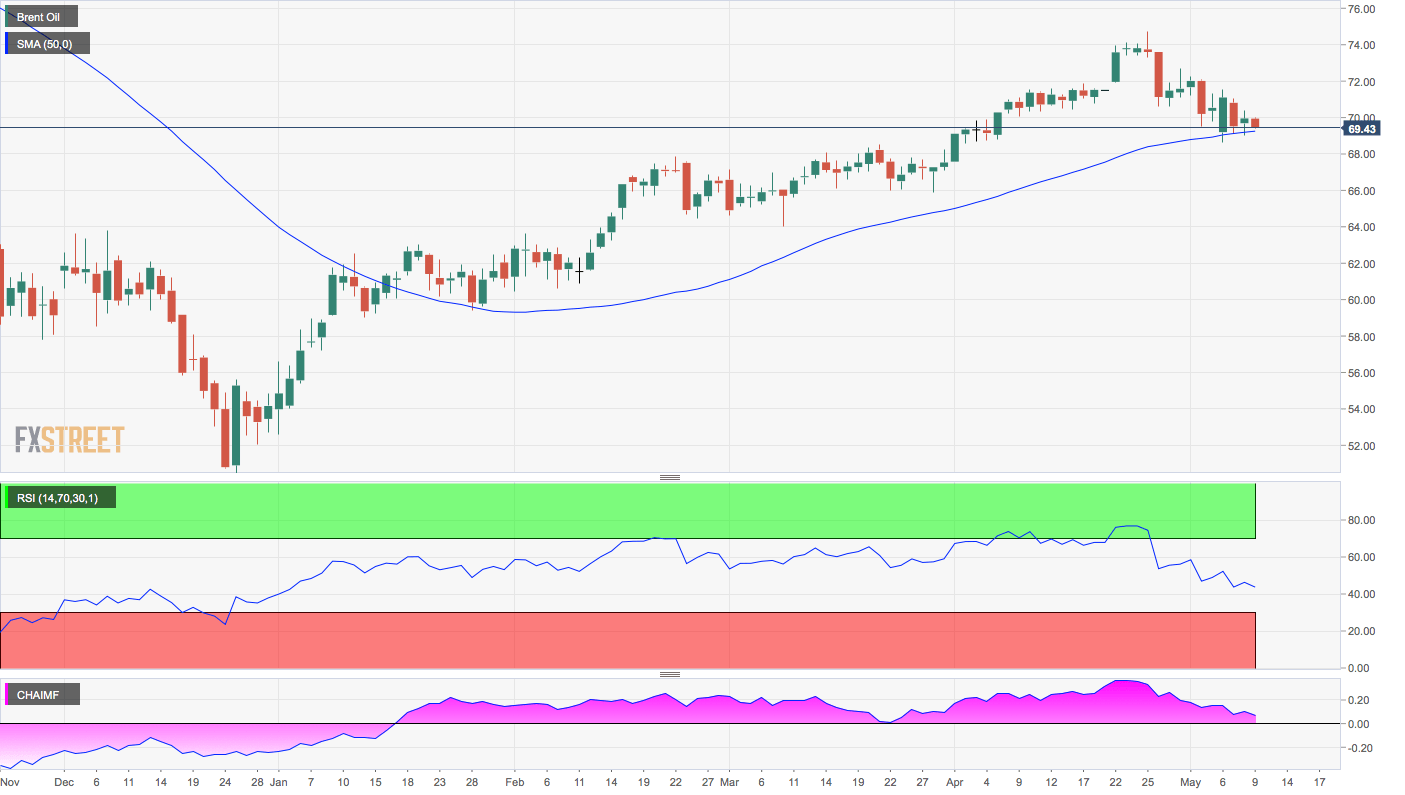
Brent is currently trading on the defensive at $69.51 and looks set to test the 50-day moving average (MA), currently at $69.25, for the third time in four days.
Prices had bounced up strongly from that average support on Monday. But buyers lost control on the very next day, allowing prices to fall back to the key support. A similar action has been seen over the last 24 hours.
The repeated failure to produce a strong bounce from the widely tracked MA support could be considered a sign bearish sign – more so, as the 14-day relative strength index (RSI) has dipped below 50 and the Chaikin money flow index, which measures buying/selling pressure, has dropped sharply from the highs seen in late April.
The black gold, therefore, could breach the 50-day MA support at $69.25 and test $68.52 (March high) in the next 24 hours or so.
The outlook would turn bullish if the 50-day MA again holds ground, fueling a price rise above Monday’s high of $71.53.
Daily chart
Trend: Bearish
Pivot points
