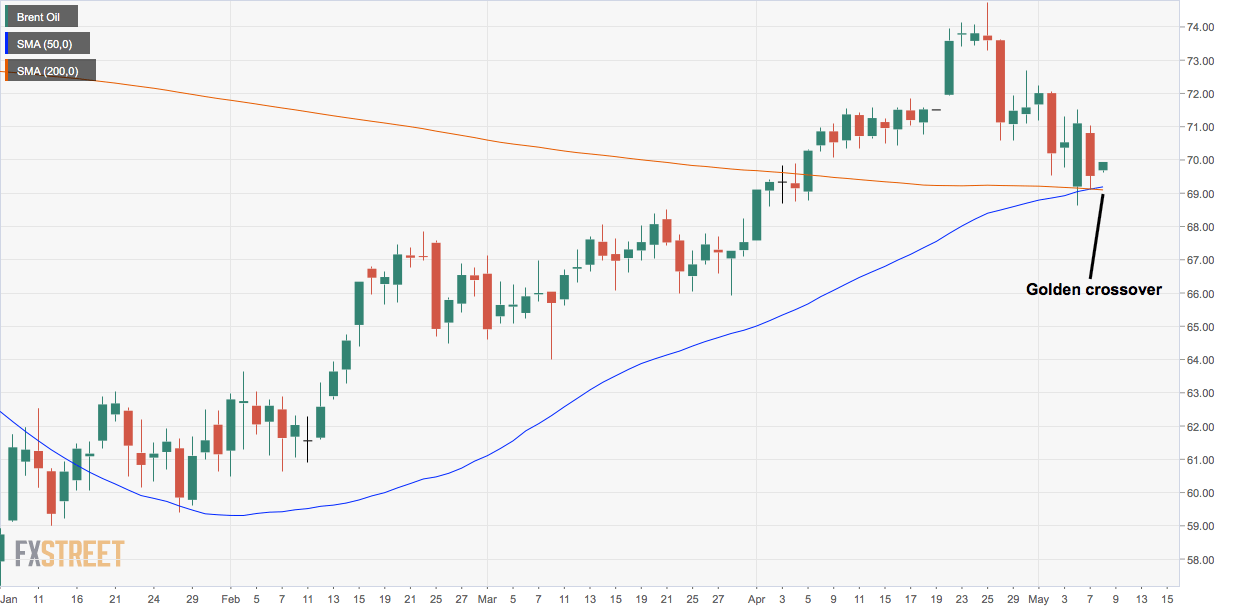
- Brent’s daily chart shows golden crossover – the first since September 2017.
- Brent’s daily RSI is well short of overbought levels. So, golden cross may yield re-test of recent highs.
With Brent’s 34.5% rally from December lows, a widely tracked long-term technical indicator has turned bullish for the first time in since September 2017.
The 50-day moving average (MA) of the price has crossed the 200-day MA from below, confirming what is popularly known as the “golden crossover” – a sign of bull market. The crossover, however, is based on backward looking moving average studies and has limited predictive powers at best.
Usually, by the time the crossover is confirmed, the markets are overbought and due for correction.
That, however, is not the case with Brent Oil, as its 14-day relative strength index (RSI) is currently located just around 50.00. So, there is plenty room for extension of the ongoing rally, as suggested by the golden cross.
As of writing, Brent is trading at $69.94 per barrel. A break above Monday’s high of $71.53 would validate the golden cross, opening the doors to re-test of the recent high of $75.58.
A case for deeper drop, however, would strengthen, if the price finds acceptance below the 200-day MA, currently at $69.17, although that looks unlikely.
Daily chart
Trend: Bullish above $71.78
Pivot points
