- Brent risks a drop to the 200-day MA at $69.25.
- Daily chart shows a bearish crossover of key averages.
Brent oil is currently trading at $71.50, representing a 0.17% drop on the day.
The oil benchmark faced rejection at the 10-day moving average (MA) yesterday and ended up creating a bearish hammer.
That candlestick pattern has reinforced the short-term bullish-to-bearish trend change witnessed last week – Brent fell 3.66% on April 26, validating the candle with a long upper shadow created on the preceding day.
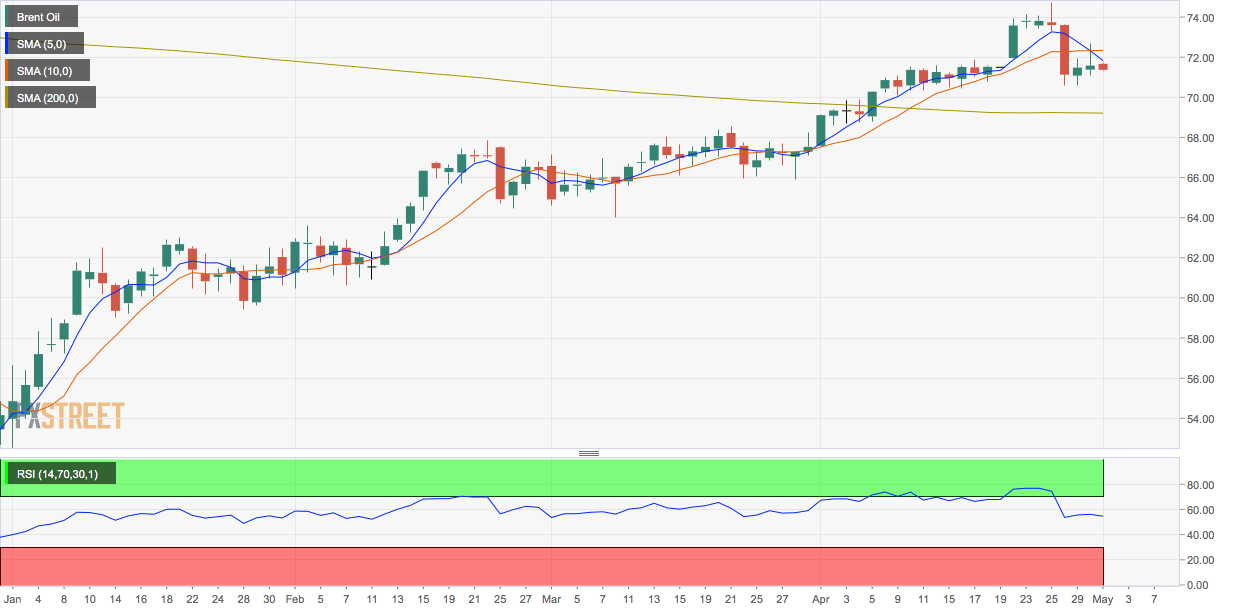
As a result, the 200-day MA support, currently at $69.25, could come into play in the next day or two.
Supporting that downside case is the bearish crossover of the 5- and 10-day MAs. The bearish outlook would be invalidated if the price closes above the 10-day M at $72.76.
Daily chart
Trend: Bearish
Pivot points
