- Brent oil is struggling to post a strong bounce from the 50-day MA support.
- The black gold has created a contracting triangle on 4-hour chart.
Brent’s pullback from the April 25 high of $75.58 seems to have run out of steam at the 50-day moving average (MA) support. So far, however, a stronger bounce has remained elusive.
Daily chart
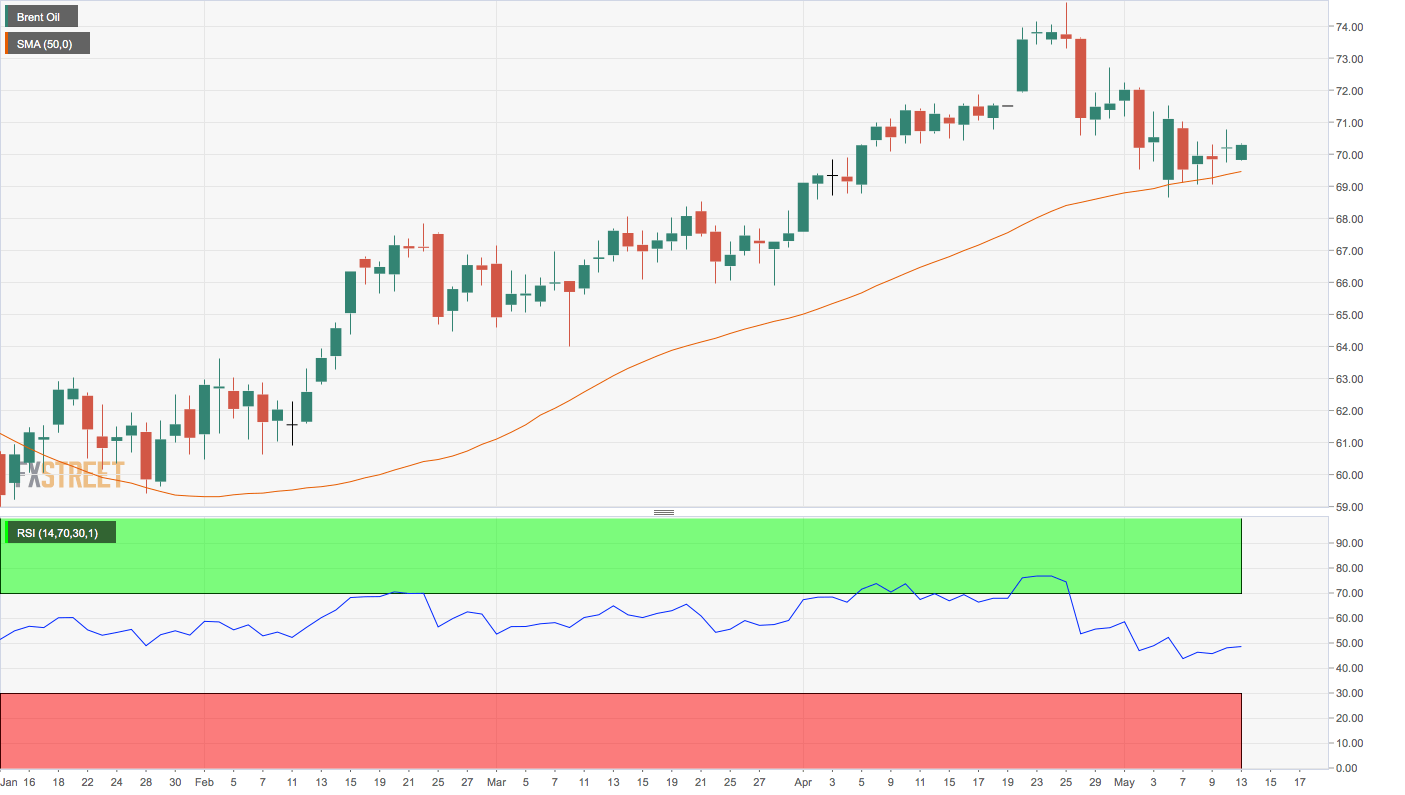
As seen above, the 50-day MA support proved a tough nut to crack n three out of the last five trading days.
While the immediate bearish outlook stands neutralized, a bullish reversal would be confirmed above $71.78 “” the high of Doji-like candle created on May 6.
A convincing break above $71.78 would open the doors to retests the recent high of $75.58.
A break above $71.78 could be seen if the contracting triangle seen on the 4-hour chart below is breached to the higher side.
4-hour chart
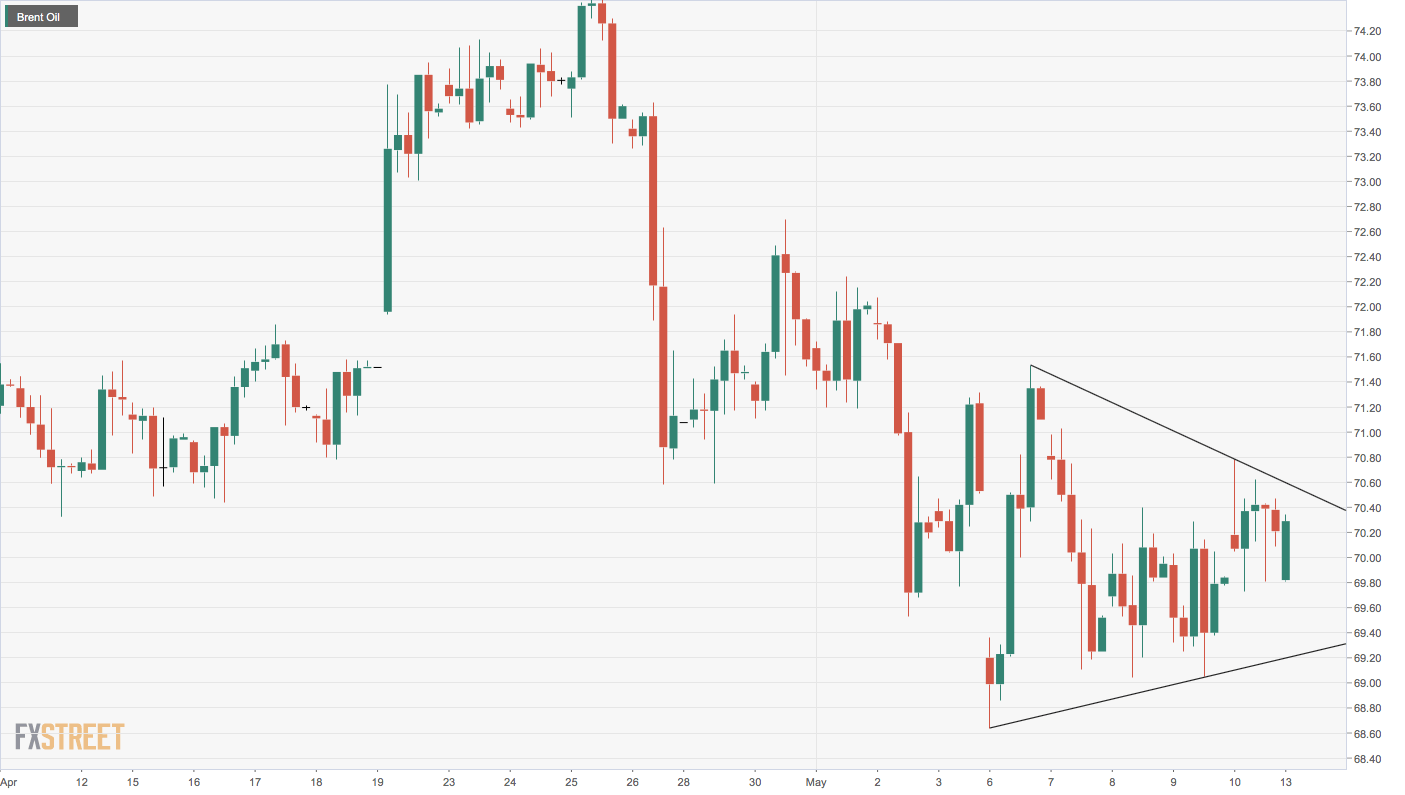
The contracting triangle breakdown, however, would imply resumption of the sell-off from the recent high of $75.58.
Trend: Bullish above $71.78
Pivot points
