The Fed decision to taper has ignited volatility in the market, and one of the majors which was affected the most is the GBPUSD pair. The GBPUSD pair is under pressure for the last couple of weeks, and even better than expected labor data failed to attract the buyers.
The pair is showing five swings down from the recent 1.6786 high.
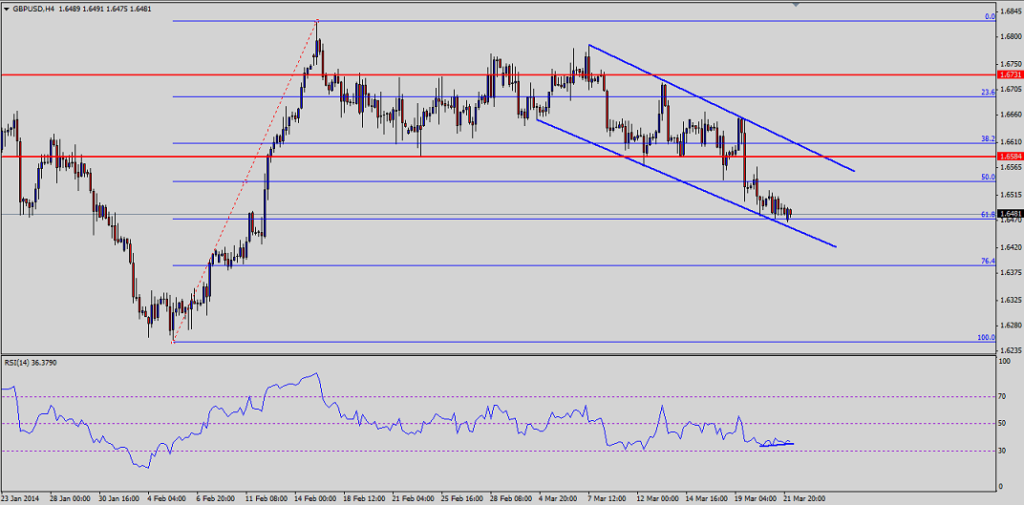
Critical Channel Break Eyed
There is an important up-move channel, which has played a significant role for the pair in the short term, as plotted in the 4 hour chart shown below. The pair as of writing is flirting with the channel support region, and tested a number of times the 1.6480/60 support levels. One important thing to note here is that this support level also represents the 61.8% Fibonacci retracement level of the last leg higher from the 1.6251 low to 1.6819 high. So, this support area is a double confluence zone for the pair, and that is the reason why it holds a lot of importance in the short term. If the pair dives below the mentioned support area and closes below the same, then the sellers can take control of the situation. The sellers could eye the 76.4% Fib retracement level in that case, followed by the previous low at around the 1.6250 level.
RSI Divergence and Trend line
There is an early-warning sign developing on the RSI as of writing. There is a minor divergence noted, as highlighted in the chart as well. This divergence could well prove to be vital, and push the pair from the current levels for the sixth swing. One need to be very careful in the coming sessions/days, and should wait for some more positive signs before jumping into a trade. On the other hand, a break of the trend line on the RSI might trigger a down-move in the pair.
Moving ahead
There is no denial that the pair can bounce from the recent support level. If the pair buyers manage to push the pair higher, then the 1.6580 level is the first major hurdle for the pair. This level also coincides with the channel resistance zone. So, keep an eye on this level if you are planning for a long setup in the sessions ahead.
KEY SUPPORT LEVELS: 1.6460 and 1.6410
MAJOR RESISTANCE LEVELS: 1.6540 and 1.6580