- USD/CAD dropped as the greenback retreated on a dovish Fed,
- Canadian inflation and GDP numbers stand out.
- The technical picture is mixed for the pair.
This was the week: Weaker USD, higher oil prices
The US dollar was on the back foot for three reasons:
1) The FOMC Meeting Minutes confirmed the dovish twist by the Fed, more on the balance sheet reduction program than on interest rates, but enough to weigh on the greenback.
2) Trade talks made progress. China offered to buy US goods and seemed receptive to the Americans’ demands for a stable yuan, aka a stronger one.
3) Weak US data: Durable goods orders beat on the headline but missed on the non-defense ex-air, the core of the core. Existing home sales also dropped. Weak data implies a dovish Fed for a longer period of time.
Oil prices continued moving up with WTI Crude Oil setting the highest levels for 2019 above $57. The increase comes despite a new record in US production: 12 million barrels per day. Will the black gold continue higher, or has it reached its limit?
Canadian retail sales dropped in December, but only by 0.1%, better than expected. Core sales did disappoint with -0.5%.
Bank of Canada Governor Stephen Poloz did not rock the boat his speech and Wholesale Sales rose by 0.3%, better than expected. All in all, an OK week for Canada.
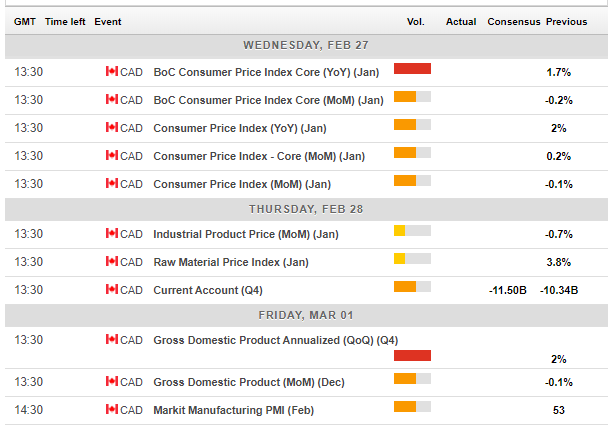
Canadian events: Inflation, GDP
The upcoming week is busier. The inflation report for January will probably continue showing OK, but not heating inflation. The Core Consumer Price Index stood at 1.7% year over year, while headline CPI was at 2%. The BOC will look at the data closely.
Thursday features the current account and additional figures, but the calendar culminates on Friday with the release of GDP. Canada publishes GDP data once a month, but this publication is for December, concluding the last quarter of 2018. Annualized growth stood at 2% in Q3, while monthly output dropped by 0.1% in November.
Both inflation and growth figures may have a lasting impact on the C$.
Here is the Canadian calendar for this week:
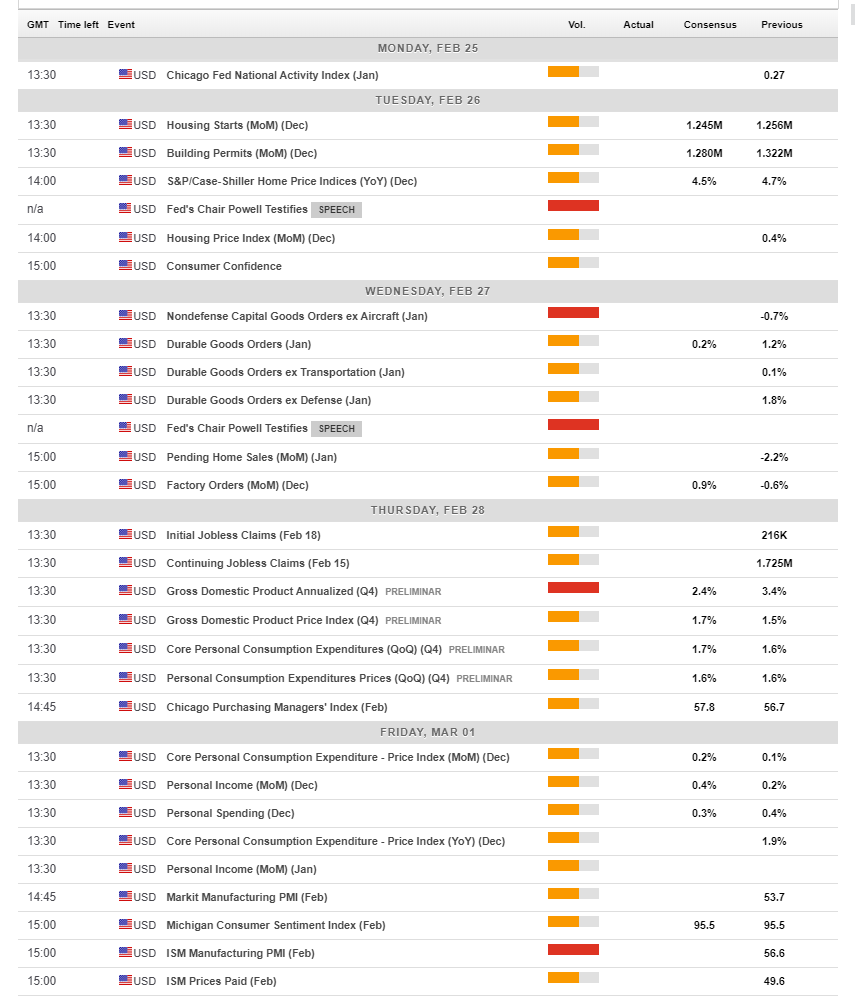
US events: Powell, GDP, and trade
A busy week awaits. Fed Chair Jerome Powell testifies on Tuesday. The Fed made a dovish shift and called for patience on raising interest rates. But do they still intend to hike this year? It is unclear at this moment and the world’s most powerful central banker may provide some clues. He will answer lawmakers’ questions on Tuesday and on Wednesday.
Another edition of the Durable Goods Orders, this time for January, will be of interest and serve as a warm up to the belated GDP report on Thursday. US growth probably slowed down in Q4 after two quarters of robust growth. The data comes out later than scheduled due to the government shutdown.
The Fed’s preferred inflation measure, the Core PCE Price Index, is due on Friday and will likely remain unchanged. The ISM Manufacturing PMI is set to impact the close on Friday. After a dive in December, it bounced in January. Apart from serving as a snapshot for the manufacturing sector, it serves as a hint towards the following week’s Non-Farm Payrolls report.
Apart from the big bulk of data and the testimony, markets will watch US-Chinese negotiations closely. At the time of writing, Presidents Trump and Xi of the US and China respectively, are not set to meet ahead of the March 1st deadline. An extension of the deadline is likely.
Here are the critical American events from the forex calendar:
USD/CAD Technical Analysis
Dollar/CAD dropped to a lower range but lacks Momentum to continue lower. The Relative Strength Index is quite balanced and the pair trades between the 50-day and 200-day Simple Moving Averages.
Support awaits at 1.3150 which was the weekly low and coincides with the 50-day SMA. Further down, 1.3060 was the low point in February and the lowest since November and may provide significant support. 1.2980 was a swing low in October and it is followed by 1.2920 which was a stubborn bottom around the same time.
1.3250 held $/CAD down recently and is the immediate line of resistance. 1.3340 capped the pair in mid-February and converges with the 50-day SMA. It is followed by the late January top of 1.3380. Next, we find 1.3420 which was a swing low in the dying days of 2018. 1.3580 provided support when USD/CAD traded on higher ground in mid-December.
-636864402517330802.png)
