Whilst the simple ups and downs of the markets are usually easy to read, there is a lot of complexity in the charts. But, just because complexities exist, doesn’t mean that finding the right chart needs to be difficult or challenging. There are two main elements; chart type and periodicity. Let’s go through the ideas behind each one to help you decide which chart setup is right for you.
Chart type
The first thing to decide when setting up a chart is which type of charting you like. Broadly, there are three types – line chart, bar chart and candlesticks.
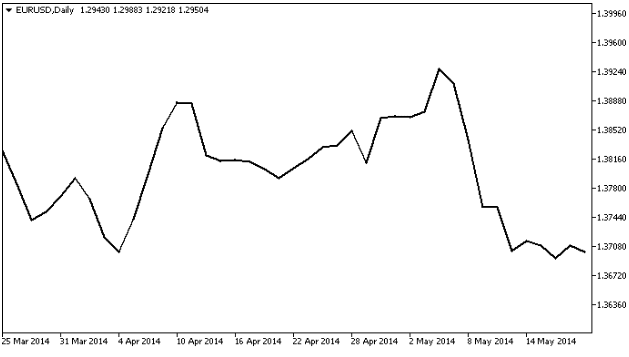
Line charts
Line charts are pretty simple. It pretty much just draws a line to the new price from the previous price. It’s easy to read and gives a good, simple way to see the trend in the market.
Bar chart
A little bit more complex than a line chart. Instead of simply moving to the close price of the period, a bar chart shows the open, close, high and low as a series of lines at varying levels along a dependent variable of value.
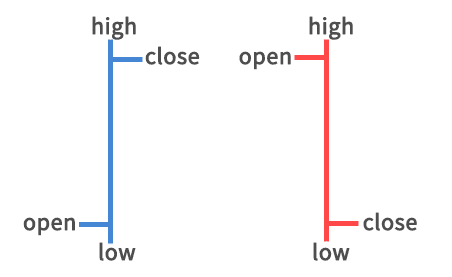
It gives more detailed information than the line chart by showing the movement within a time period, rather than simply the close price. This helps address a limitation of the line chart by showing what the market is doing during the period selected.
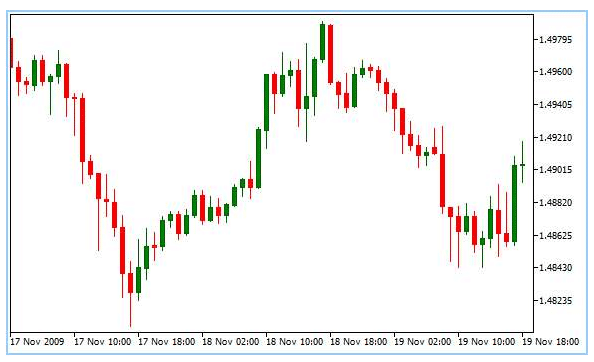
Candlesticks
A nice name for a nice chart, the candlestick basically takes the information shown in the bar chart and puts the open / close values in a box. With the high / low being displayed at the end of an attached line, it is visually reminiscent of a candlestick (or a stick of dynamite).
Which chart setup you choose will depend on a few aspects. The bar chart is useful for visualizing trend directions simply, so if you only want this information, this is ideal. Candlesticks / bar charts will also enable you to see trends, but for determining volatility or trying to visualize support and resistance points, the candlestick / bar will show how often the levels are tested in a more detailed way than the line chart.
On top of this, there are particular trading methods that are specific of candlestick / bar formations. Candlestick formations with bizarre sounding names like the hanging man, hammer, inverted hammer or shooting star can be used to show reversals and are often the basis of trading entry / exit points. There is even a version called Japanese candlesticks for those who like this method.
Periodicity
The other component for setting the chart is the time frame, or periodicity as it will say on the charting software. The different options simply reflect the timeframe for each point. Put simply, a five minute chart will show the trading period from open to close over 5 minutes, whilst a minute chart will show the open and close difference over 1 minute.
The periodicity when setting the charts should reflect the trading timeframe of your strategy. For someone that is looking to trade a short term timeframe, the periodicity needs to reflect the short timeframe needed. Same for a longer timeframe. There is limited value in a long term buy and hold trader using a 15-minute chart, as it won’t show the trend to reflect good entry and exit points.
With periodicity, it is often useful to have two different periods in play. The first should be to determine the entry/ exit point of the trade, whilst a second, often longer periodicity, should be used to get a different perspective of the trade, to understand the broader trend.
Chart setup should allow you to undertake your strategy and give you the visual tools to make the best trading decisions.