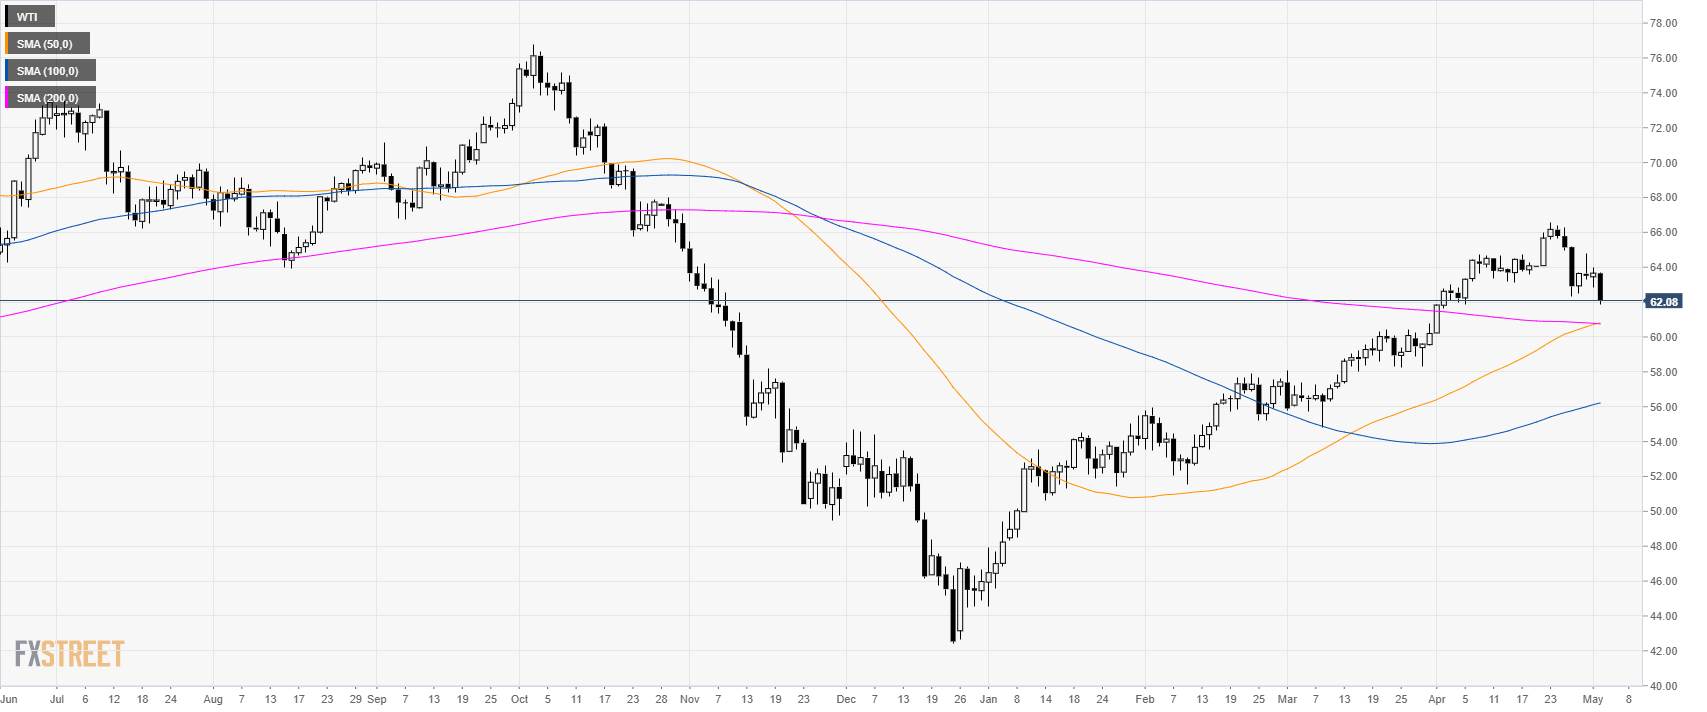
Home Crude Oil Technical Analysis: WTI melts down sub-$62.00 a barrel
FXStreet News

Crude Oil Technical Analysis: WTI melts down sub-$62.00 a barrel

Oil daily chart

  • WTI is trading in a bull trend above its main simple moving averages (SMAs).
  • WTI is back to April’s lows near 62.00 figure.
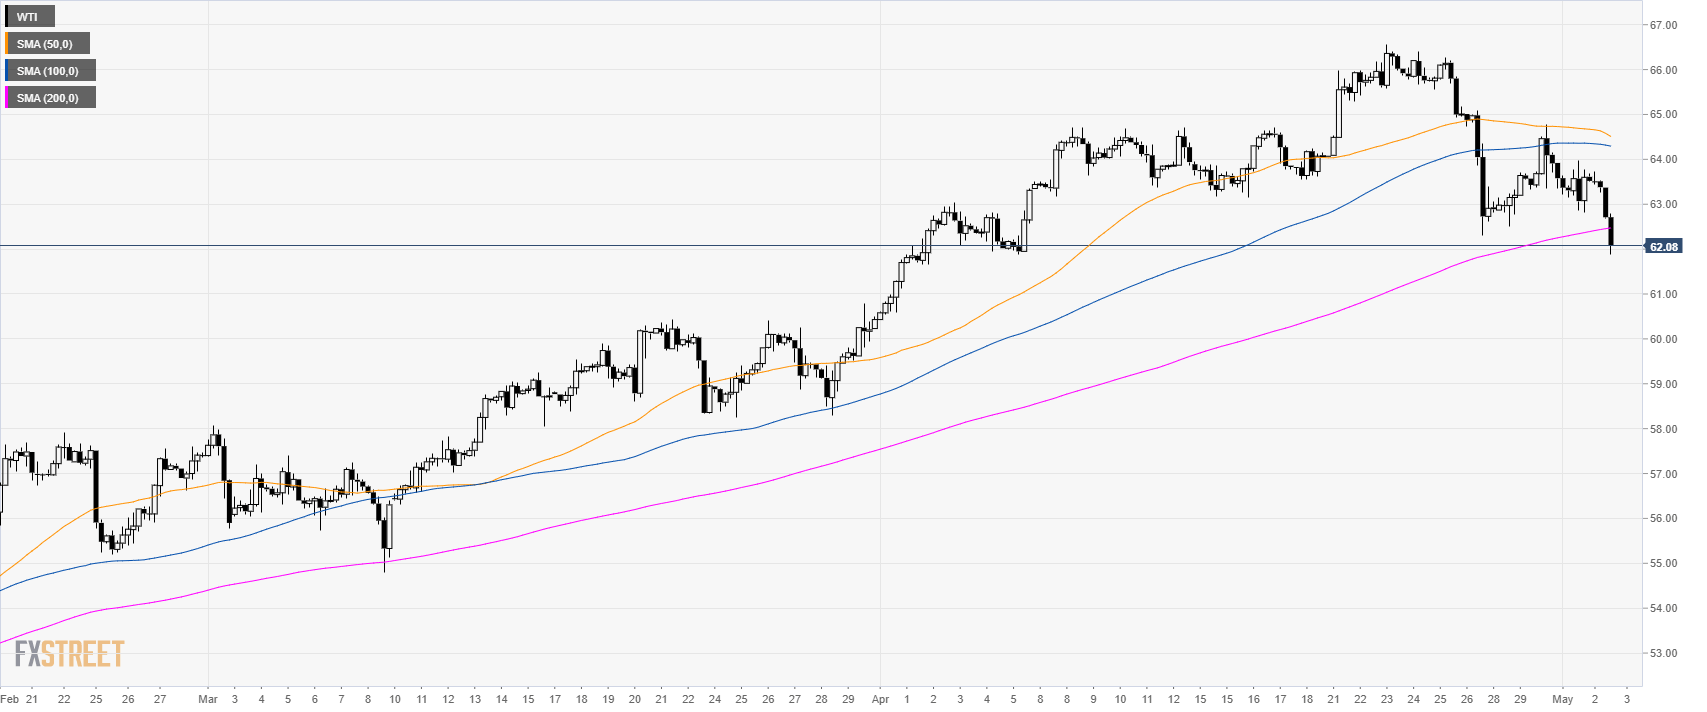
Oil 4-hour chart


  • Oil is trading below its main SMAs suggesting a bearish momentum in the medium-term.
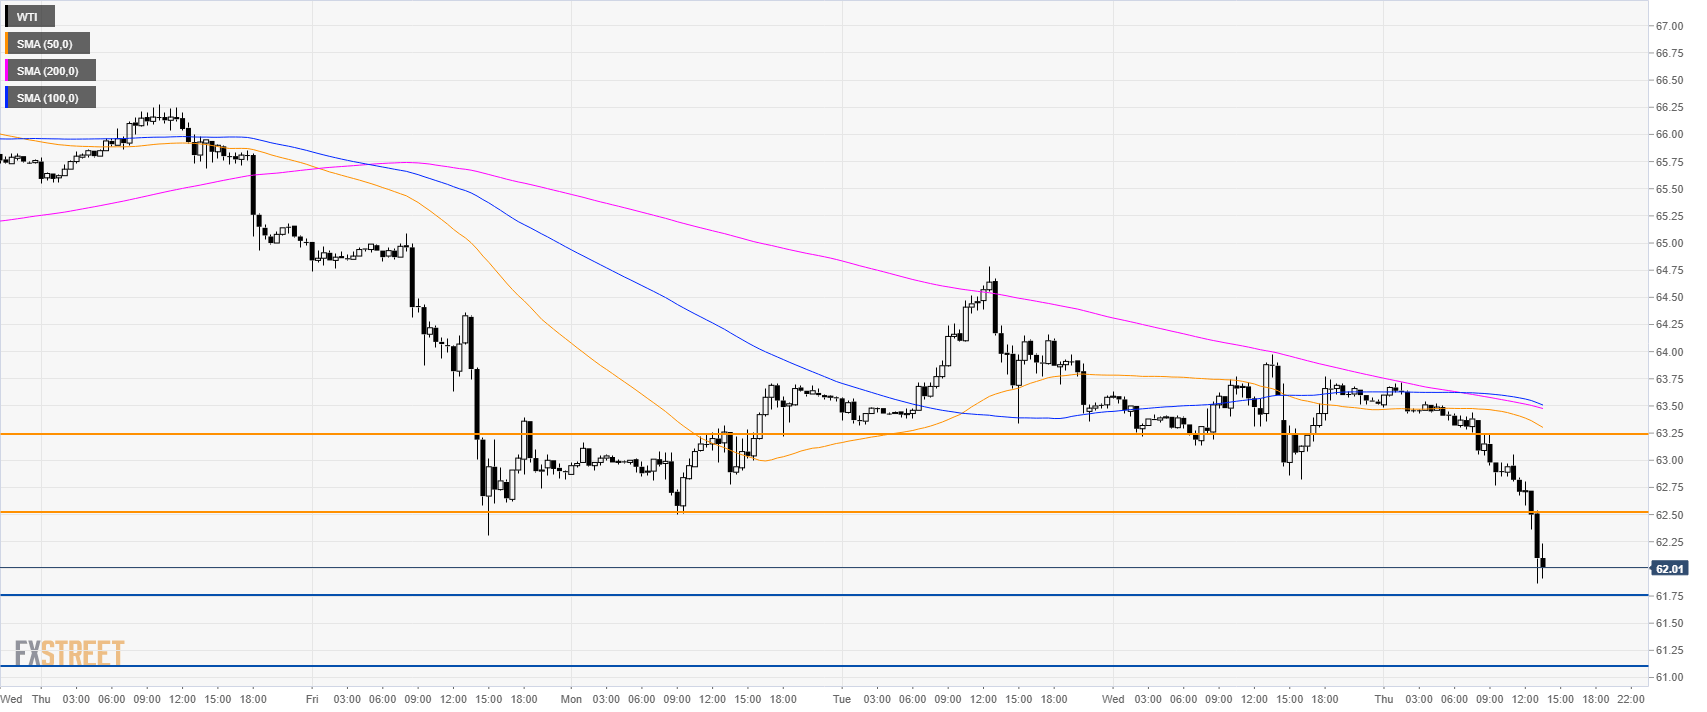
Oil 30-minute chart

  • WTI is trading below its main SMAs suggesting a downward bias in the short-term.
  • A break below 61.75 can see an extension of the bear leg towards 61.10.
  • Resistance is at 62.50 and 63.25 level.

Additional key levels


FX Street

FX Street

FXStreet is the leading independent portal dedicated to the Foreign Exchange (Forex) market. It was launched in 2000 and the portal has always been proud of their unyielding commitment to provide objective and unbiased information, to enable their users to take better and more confident decisions.