- Crude oil tried to breakout above 68.30 resistance but then collapsed into the 66.30-67.16 area (yellow rectangle).
- Crude oil is having sharp swings in both directions as market participants are trying to find a direction.
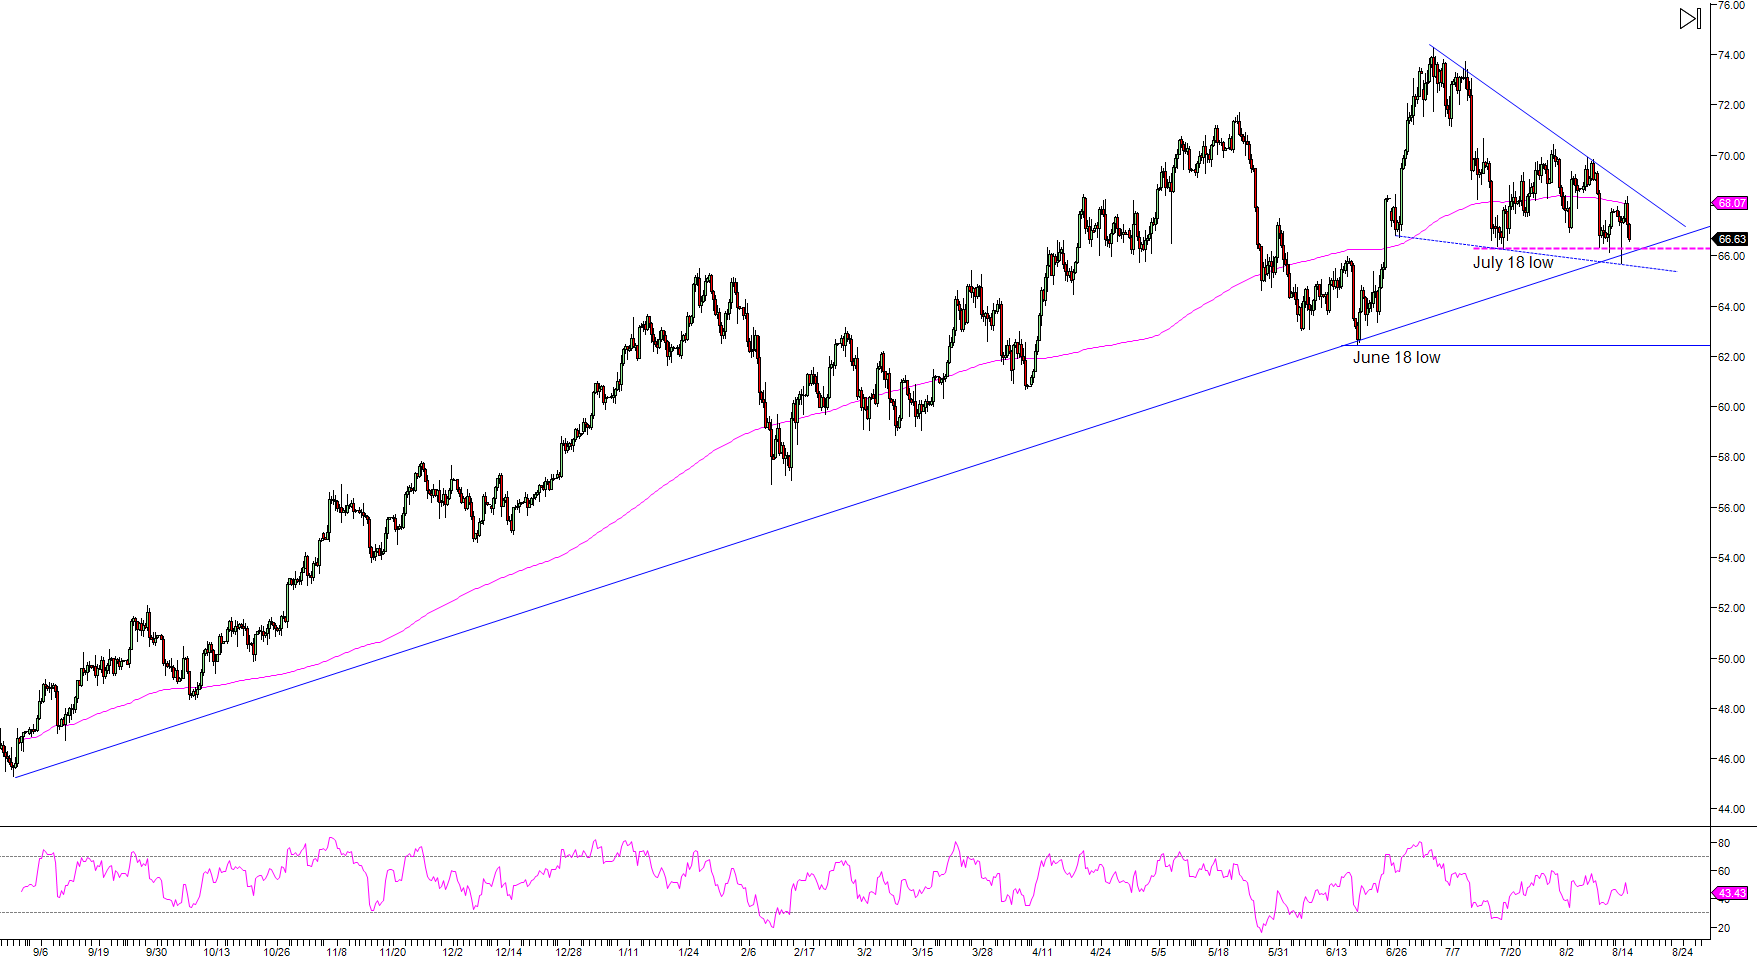
- As its stands, bears now have a slight advantage if they are able to have a daily close below the 66.30, July 18 swing low.
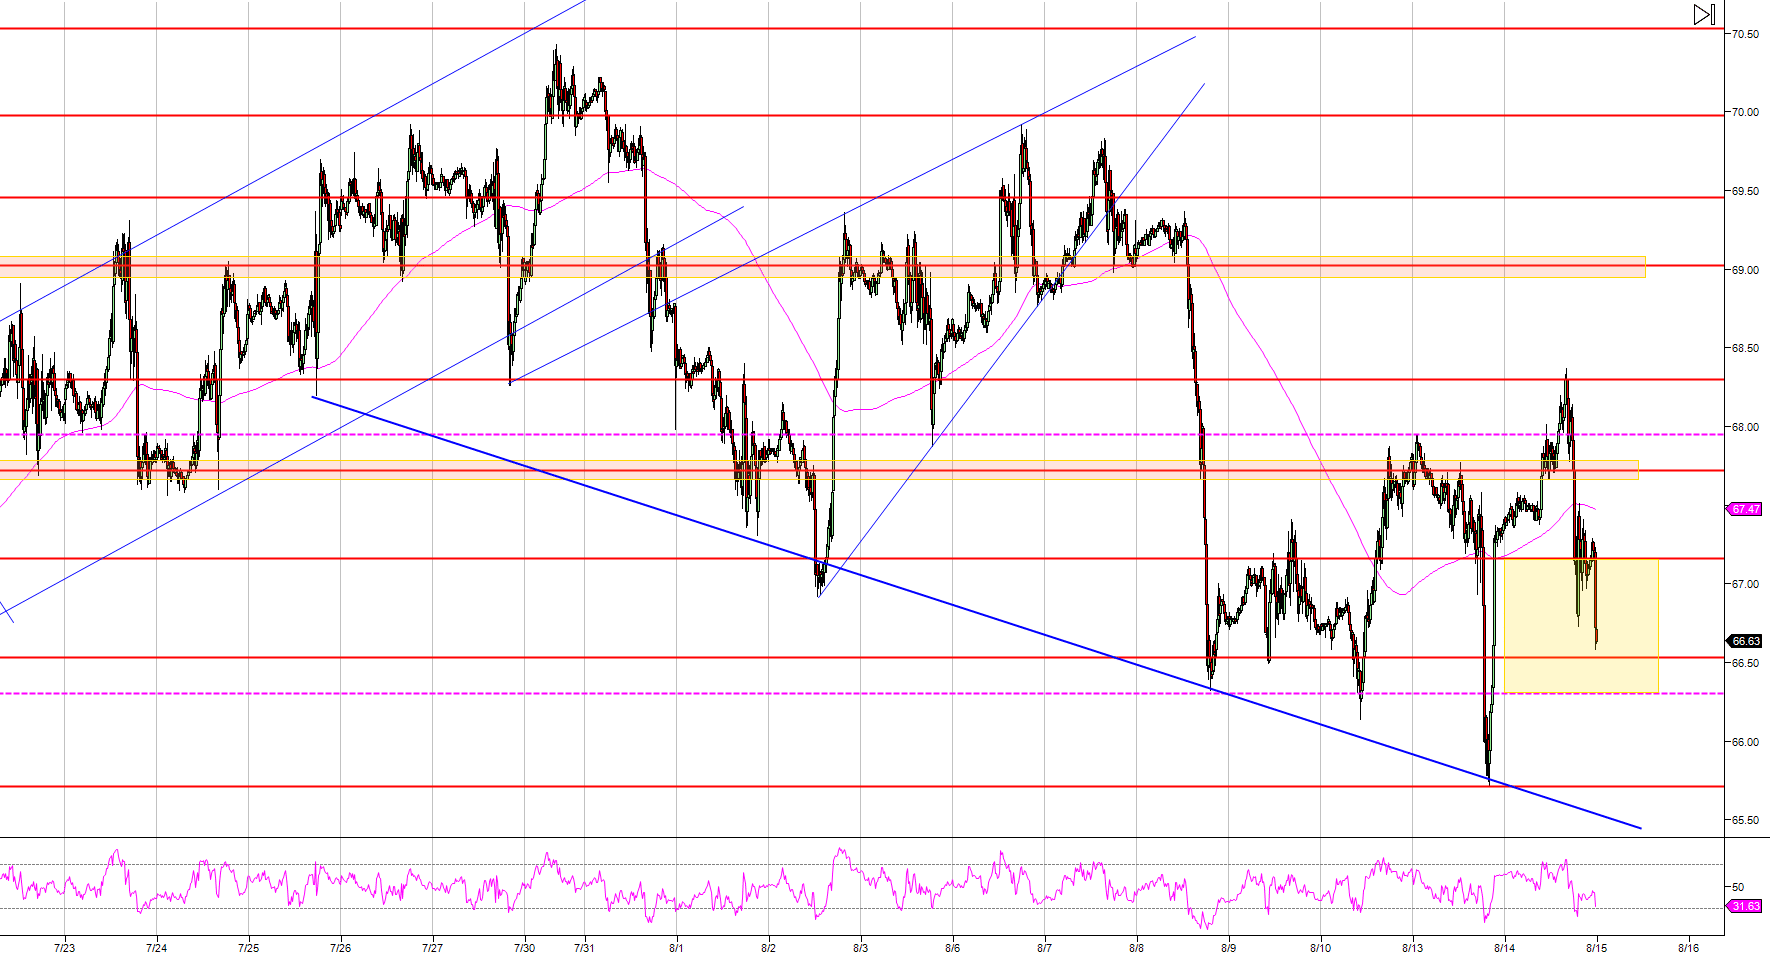
Crude oil WTI 480-minute chart
Spot rate: 66.63
Relative change: -1.17%
High: 68.37
Low: 66.58
Main Trend: Bullish
Resistance 1: 67.16 June 14 high
Resistance 2: 67.72 June 26 low
Resistance 3: 67.95 swing high
Resistance 4: 68.30 supply/demand level
Resistance 5: 69.00 figure
Resistance 6: 69.44 June 25 high
Resistance 7: 70.00 figure
Resistance 8: 70.53 May 24 low
Resistance 9: 71.19 May 23 low
Resistance 10: 72.13 July 6 low
Resistance 11: 73.00 figure
Support 1: 66.30-66.53 July 18 swing low and June 20 high
Support 2: 65.71, June 22 low
Support 3: 65.00 figure
Support 4: 64.60 May 28 low
Support 5: 64.00 figure
Support 6: 63.63 June 11 low
Support 7: 62.40 June 18 low
