- Crude oil fell through the bullish trendline and reached the 68.30 support after the Baker Hughes weekly report revealed drillers added three rigs last week.
- Although crude oil took a $1 hit on the news, WTI prices should remain supported as oil is essentially having a pullback to 68.30 which is a key supply/demand level. However, failure to hold prices above the level can be interpreted as bullish weakness and more downside can be on the cards in such scenario.
Crude Oil WTI 15-minute chart
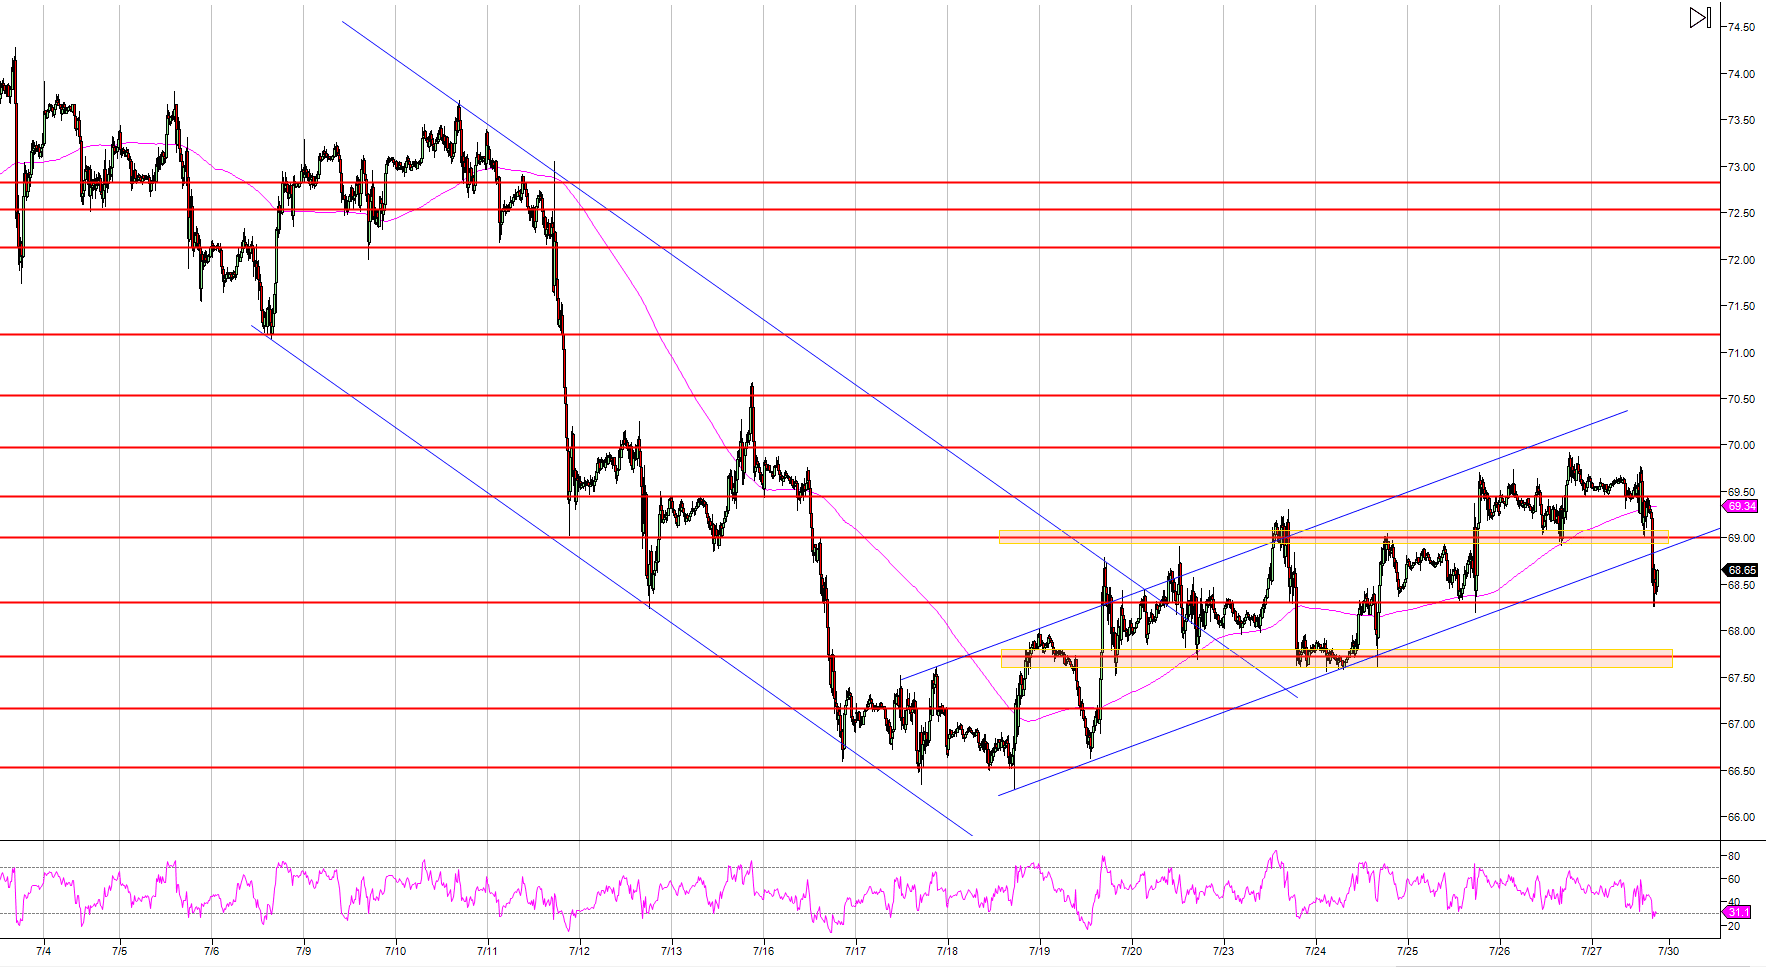
Spot rate: 68.57
Relative change: -1.32%
High: 69.75
Low: 68.22
Trend: Bullish
Resistance 1: 69.00 figure
Resistance 2: 69.44 June 25 high
Resistance 3: 70.00 figure
Resistance 4: 70.53 May 24 low
Resistance 5: 71.19 May 23 low
Resistance 6: 72.13 July 6 low
Resistance 7: 73.00 figure
Support 1: 68.30 supply/demand level
Support 2: 67.72 June 26 low
Support 3: 67.16 June 14 high
Support 4: 66.53 June 20 high
Support 5: 65.71, June 22 low
Support 6: 65.00 figure
