Home Crude Oil WTI Technical Analysis: Risky bull trap
FXStreet News

Crude Oil WTI Technical Analysis: Risky bull trap

  • Crude oil pushed as high as 70.70 so far this Tuesday, just one tick shy from the 70.71 resistance, the November 17, 2014 low.  
  • Crude oil has been grinding higher in a wedge shape (dotted line) above the bearish upper trendline in the last three days suggesting that bulls might  actually be in a bull trap.  
  • However, a bull breakout above 74.71 should lead to bear capitulation and the market can spike to 75.27 the current 2018 high.
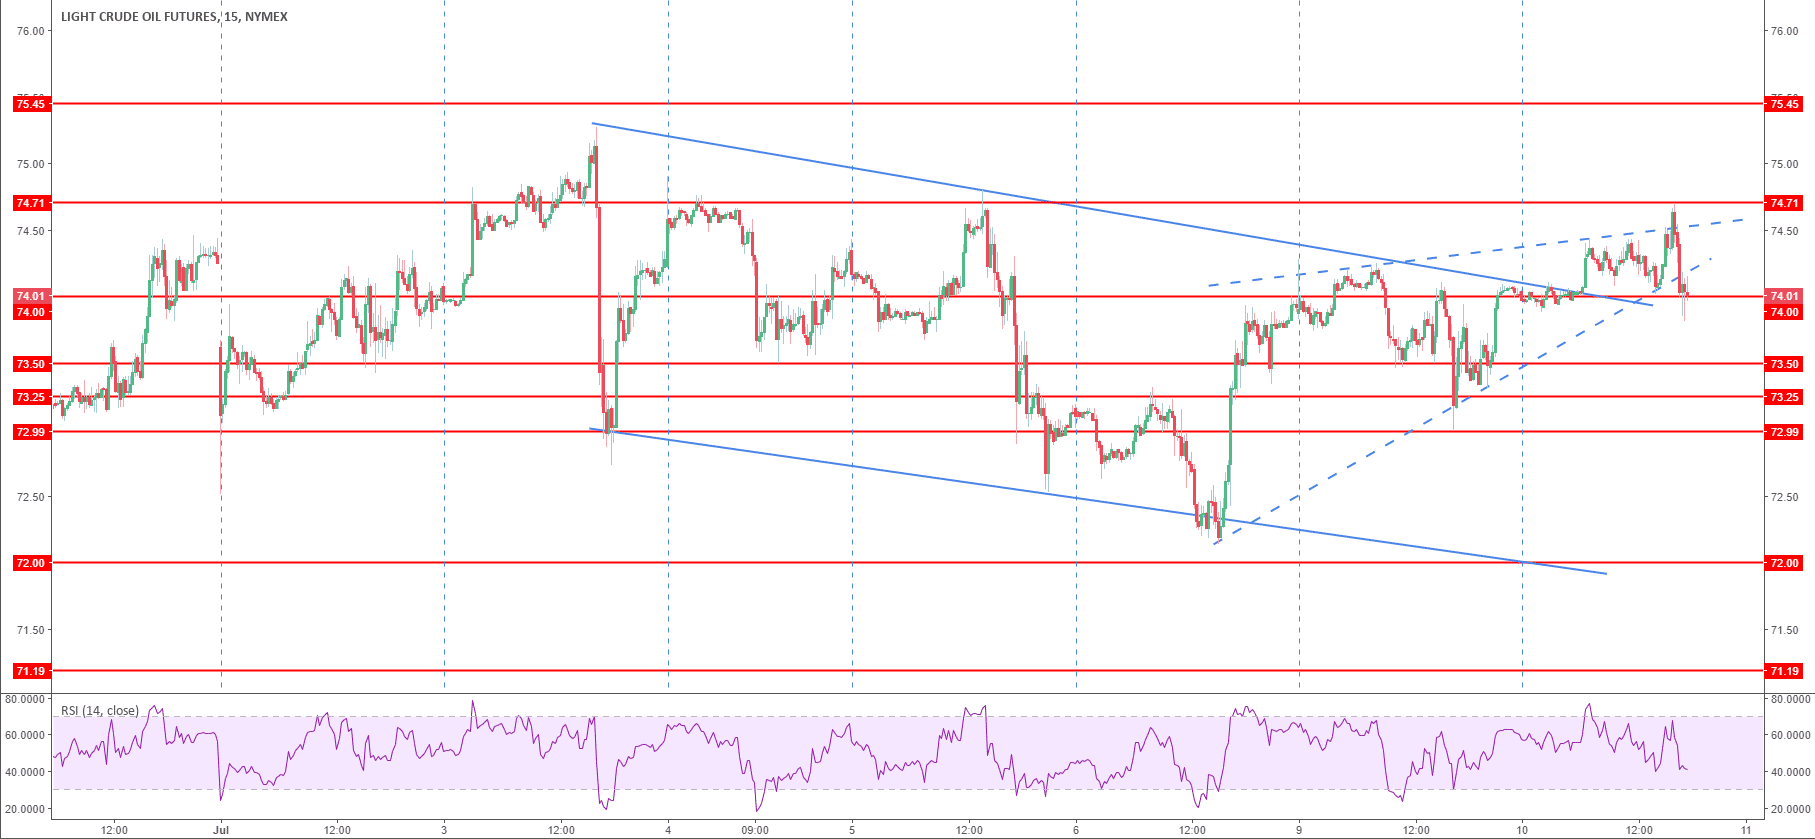
Crude oil WTI 15-minute chart

Spot rate:                      74.01
Relative change:           0.03%      
High:                             74.67
Low:                              73.78

Trend:                           Neutral to bearish

Resistance 1:                            74.71 November 17, 2014 low
Resistance 2:                            75.27 current 2018 high          
Resistance 3:                            75.45 November 24, 2014 low
Resistance 4:                            76.00 figure

Support 1:                     74.00 figure
Support 2:                                      73.25 November 14, 2014 low                  
Support 3:                                      73.00 figure
Support 4:                                      72.83 June 27 swing high
Support 5:                                      72.00 figure              
Support 6:                                      71.19 May 23 low            
Support 7:                                      70.53 May 24 low    

FX Street

FX Street

FXStreet is the leading independent portal dedicated to the Foreign Exchange (Forex) market. It was launched in 2000 and the portal has always been proud of their unyielding commitment to provide objective and unbiased information, to enable their users to take better and more confident decisions.