The dollar index, which tracks the greenback’s value against major currencies, has carved out an inverse head-and-shoulders pattern on the daily chart.
Tne neckline resistance is currently seen at 90.92. A close higher would confirm a breakout or bearish-to-bullish trend change, creating room for a rally to at least 92.63 (target as per the measured move method).
On the downside, the low of the right shoulder – 90.045 – is the level to beat for the sellers.
At press time, the DXY is trading moderately higher on the day near 90.75.
Daily chart
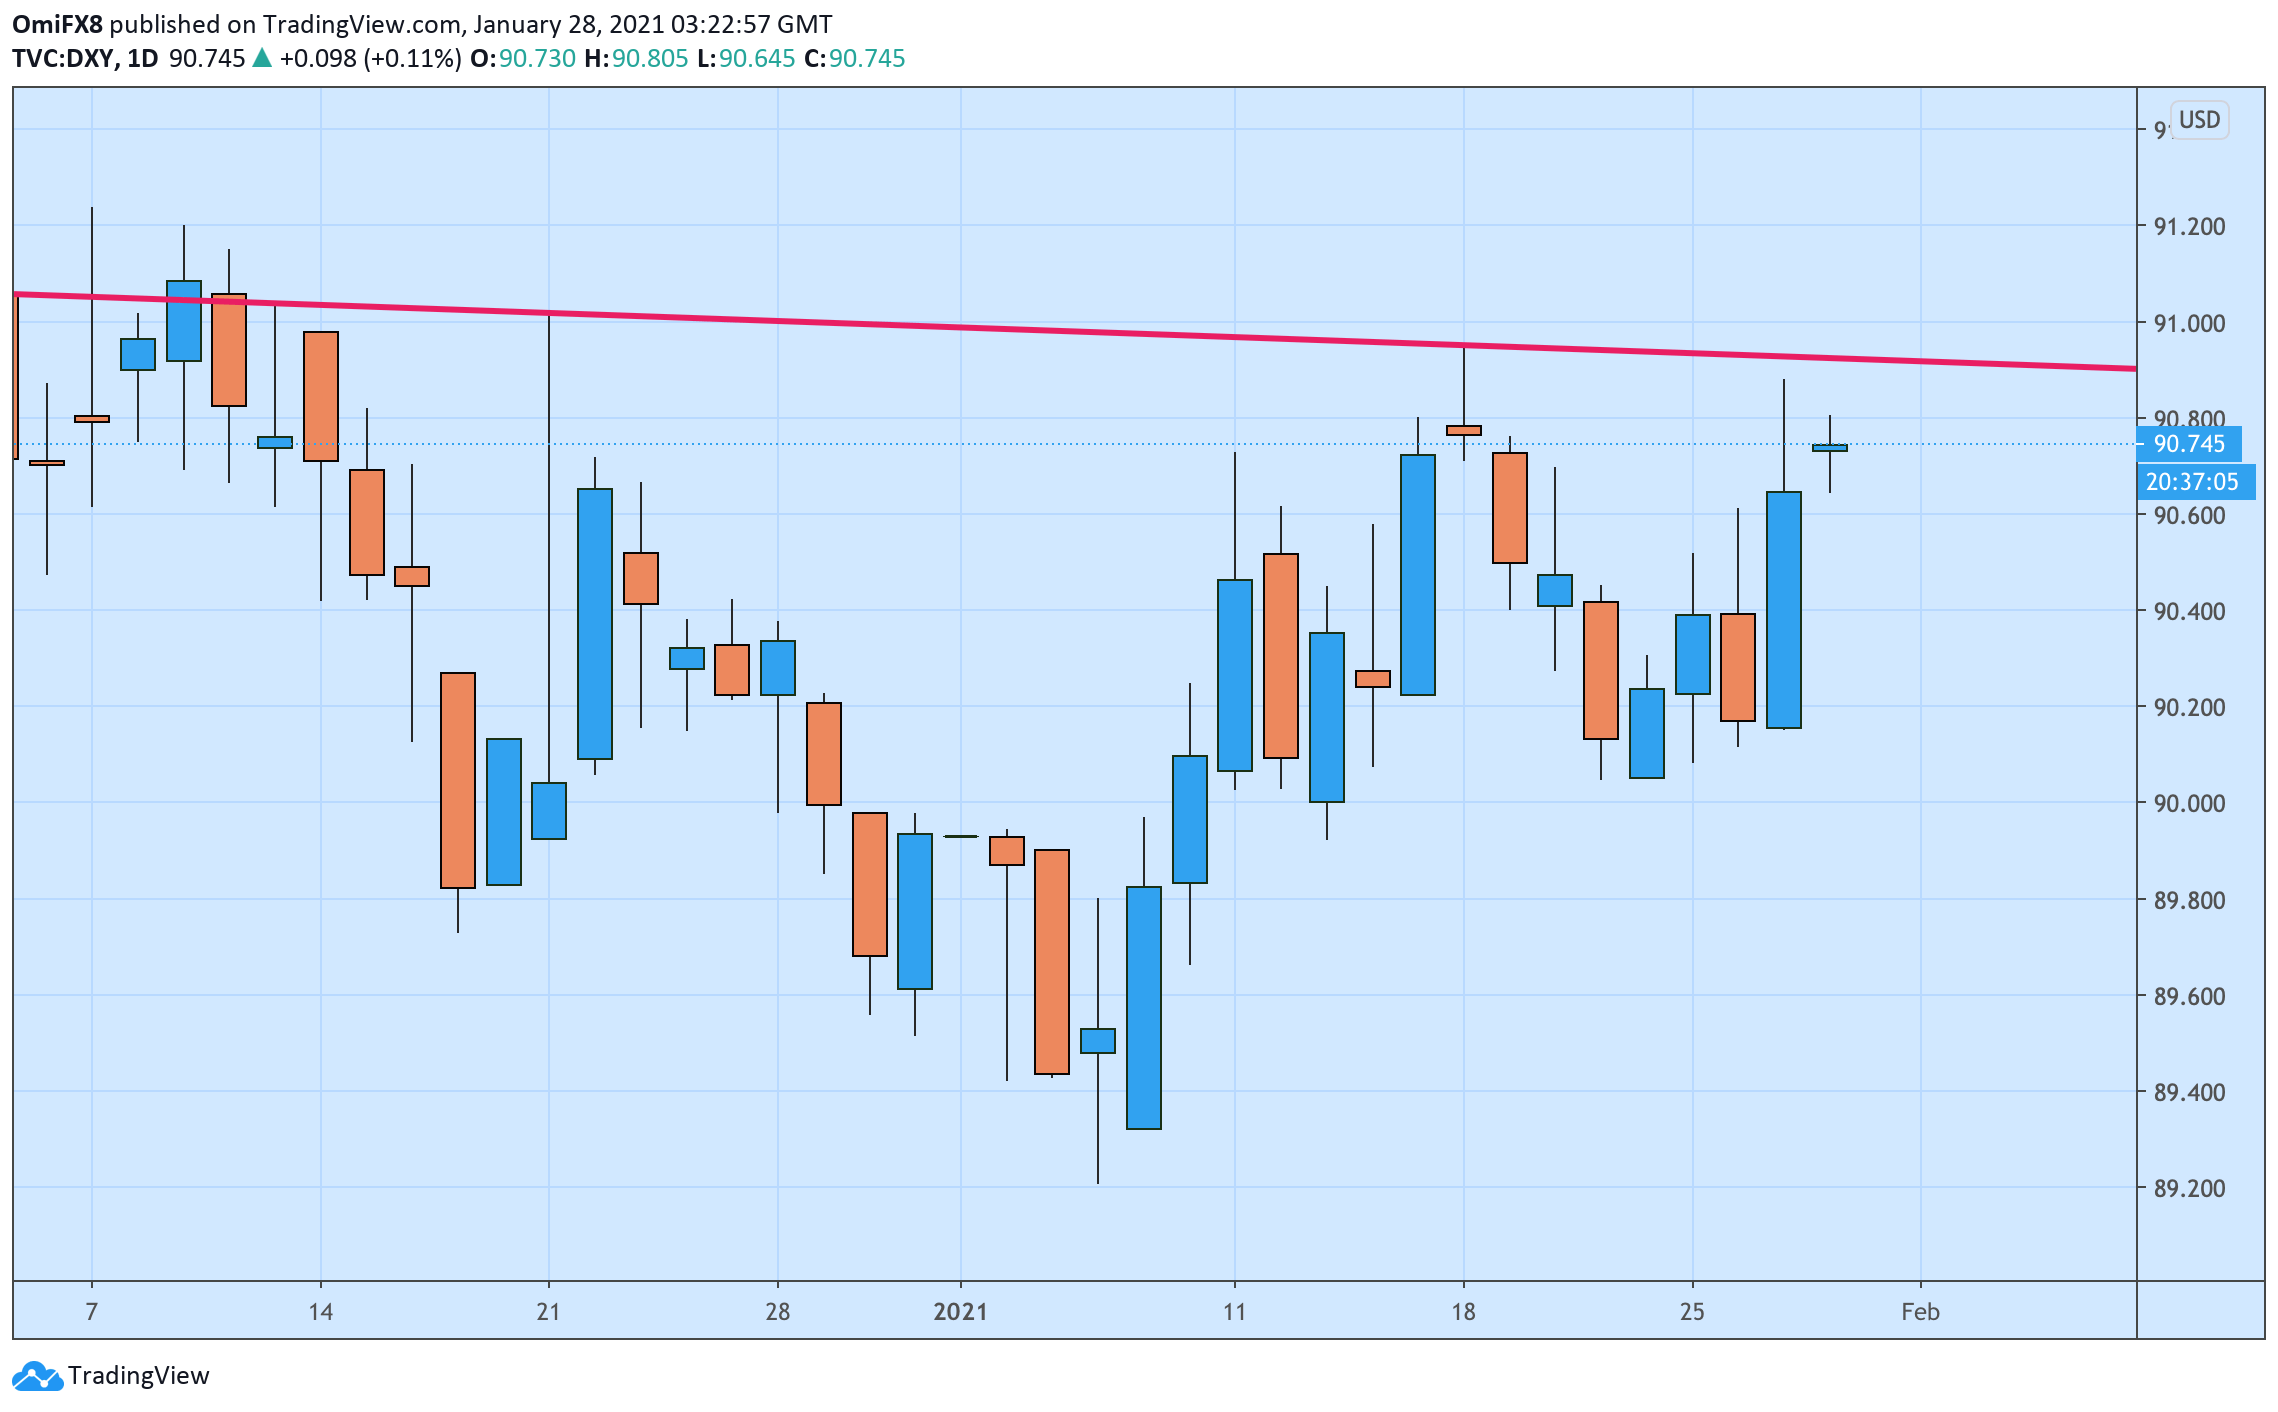
Trend: Bullish above 90.92
Technical levels
