- DXY is fading last Friday’s advance and stays poised to test last week’s multi-week low at 94.36, as the ‘tariffs-trade’ appears to be losing momentum along with a better tone from the EM FX space.
- The area of support in the mid-94.00s is so far reinforced by the 100-day SMA at 94.52.
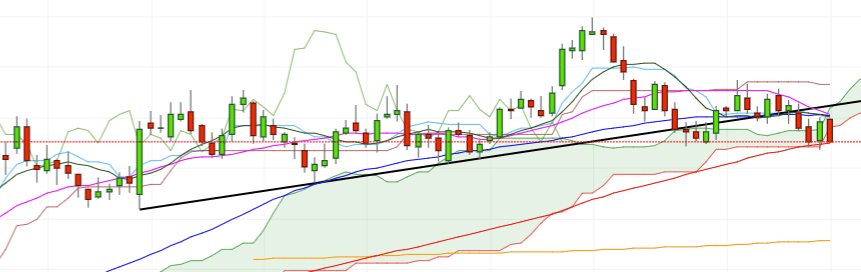
- Last week’s breakdown of the key short-term support line adds to potential deeper pullback, which faces immediate target at 94.20, 38.2% Fibo retracement of the 2017-2018 drop ahead of 94.08 (late July low).
DXY daily chart
Daily high: 94.52
Daily low: 94.46
Support Levels
S1: 94.56
S2: 94.14
S3: 93.92
Resistance Levels
R1: 95.20
R2: 95.42
R3: 95.84
