- DXY is down for the second session in a row today, coming down to test once again hourly lows in the mid-96.00s after hitting fresh YTD peaks in the 97.00 handle earlier in the week.
- The constructive bias around the buck remains unchanged as long as the support line off June’s lows, today at 94.66, continues to underpin.
- The index remains poised to further declines following the bearish divergence in the daily RSI. This retracement should meet initial support at 96.04 (50% Fibo retracement of the 2017-2018 drop) ahead of 95.92, where is located the 10-day SMA. In case the down move accelerates, the 200-week SMA at 95.45 should come to the fore.
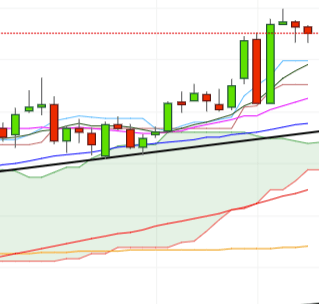
DXY daily chart
Daily high: 96.66
Daily low: 96.31
Support Levels
S1: 96.35
S2: 96.11
S3: 95.91
Resistance Levels
R1: 96.79
R2: 96.99
R3: 97.23
