- The index reverted the initial negative mood and is now challenging tops in the vicinity of 96.70, offsetting Friday’s pullback.
- A break above YTD peaks just below the 97.00 milestone should put 97.87 on the horizon, where we can see a Fibo retracement of the 2017-2018 drop and June 2017 peak.
- Sustaining the buck’s rally, the index is extending the move above the daily cloud.
- Further out, DXY stays bid as long as July’s low at 93.71 underpins.
DXY daily chart
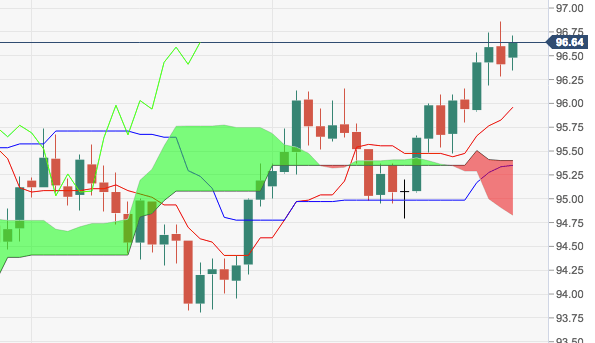
Dollar Index Spot
Overview:
Last Price: 96.62
Daily change: 21 pips
Daily change: 0.218%
Daily Open: 96.41
Trends:
Daily SMA20: 95.72
Daily SMA50: 95.21
Daily SMA100: 95.06
Daily SMA200: 93
Levels:
Daily High: 96.86
Daily Low: 96.28
Weekly High: 96.86
Weekly Low: 95.47
Monthly High: 95.74
Monthly Low: 93.81
Daily Fibonacci 38.2%: 96.5
Daily Fibonacci 61.8%: 96.64
Daily Pivot Point S1: 96.17
Daily Pivot Point S2: 95.94
Daily Pivot Point S3: 95.59
Daily Pivot Point R1: 96.75
Daily Pivot Point R2: 97.1
Daily Pivot Point R3: 97.33
