- The sharp down move in the index found decent support in the 95.50/40 region for the time being, where sits the key 21-day SMA and the 200-week SMA.
- DXY is extending the rejection from last week’s fresh 13-month tops in levels just shy of the 97.00 milestone (August 15), all in response to recent comments by President Trump and a somewhat better mood in the EM FX space.
- In spite of the ongoing correction lower, the prospect for the greenback remains constructive as long as the support line off June’s low underpins (today at 94.66). While this area holds, another visit to recent tops near 97.00 the figure should not be ruled out.
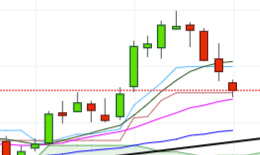
DXY daily chart
Daily high: 95.80
Daily low: 95.44
Support Levels
S1: 95.58
S2: 95.35
S3: 94.94
Resistance Levels
R1: 96.22
R2: 96.63
R3: 96.86
