- DXY is struggling to generate some serious traction, while the buck appears so far supported around the 94.35/30 band.
- It looks like the index is attempting to consolidate in the lower end of the range, coincident with August’s lows.
- Immediate hurdle in case the greenback resumes the upside remains the 94.88/95/05 band, home of the 10-, 21- and 55-day SMA ahead of the more relevant short-term now) resistance line, today at 95.25.
- A deeper retracement could lead to a test of 94.20 (38.2% Fibo retracement of the 2017-2018 drop) ahead of 94.08 (late July low).
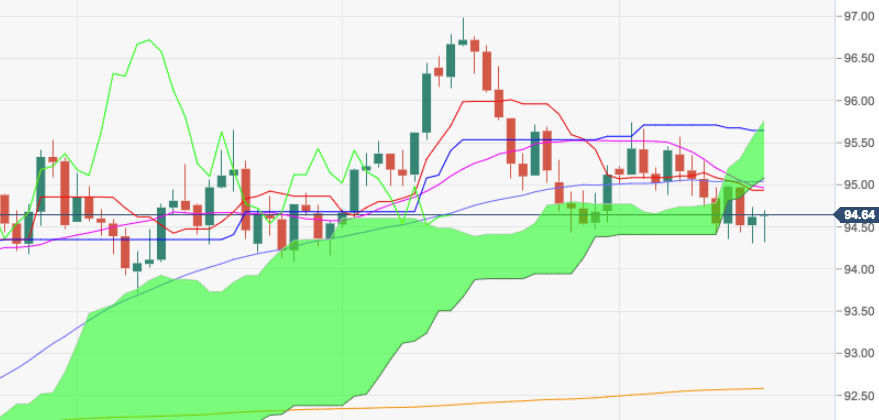
DXY daily chart
Daily high: 94.69
Daily low: 94.32
Support Levels
S1: 94.37
S2: 94.12
S3: 93.94
Resistance Levels
R1: 94.80
R2: 94.98
R3: 95.23
