“¢ The index, over the past one week, has been oscillating within a broader trading range, forming a rectangular chart pattern on the 1-hourly chart.
“¢ On the said chart, the index now seemed to find support near a short-term ascending trend-line, albeit the uptick remained capped at 100-hour SMA.
“¢ The subdued/range-bound price action clearly seems to indicate a wait and watch approach ahead of the key event risk – the latest FOMC decision.
“¢ Hence, it would be prudent to wait for a convincing break through the near-term trading range before positioning for the near-term trajectory.
US Dollar Index 1-hourly chart
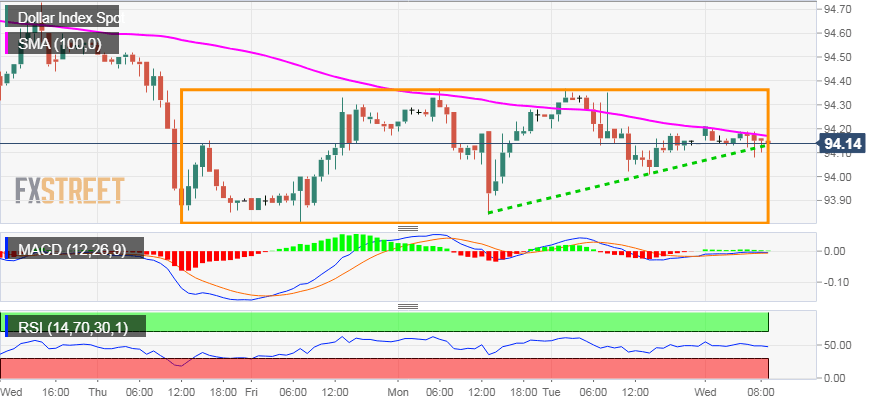
Spot Rate: 94.14
Daily High: 94.21
Daily Low: 94.08
Trend: Sideways
Resistance
R1: 94.37 (trading range hurdle)
R2: 94.61 (100-day SMA)
R3: 95.00 (psychological mark)
Support
S1: 93.80 (lower end of the trading range)
S2: 93.40 (horizontal zone)
S3: 93.17 (June month swing low)
