- The recent upside momentum around the index lost some vigour in the mid-96.00s, allowing for the current knee jerk to the 96.30/20 area.
- Occasional dips, however, have met contention in the 96.15/20 band, or hourly lows.
- On the daily chart, the bearish divergence between prices and the RSI (14) allows for a deeper correction in the near term, which should meet interim support at 95.39 (10-day SMA) and 95.02 (21-day SMA).
- The constructive stance, in the meantime, is poised to remain unchanged while the short-term support line, today around 94.55, holds.
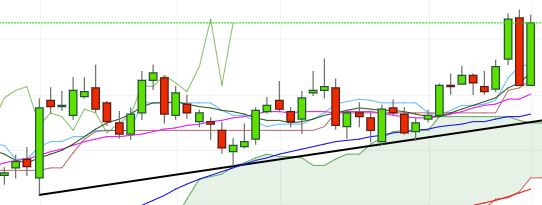
DXY daily chart
Daily high: 96.44
Daily low: 96.15
Support Levels
S1: 96.13
S2: 95.96
S3: 95.7
Resistance Levels
R1: 96.49
R2: 96.68
R3: 96.85
