- The index is now seeing some relief and manages to regain the positive territory after four consecutive daily pullbacks, finding decent contention in the 94.40 zone once again.
- This area of support is reinforced by the proximity of the 100-day SMA (94.48). The loss of this area could spark a deeper retracement to the Fibo retracement of the 2017-2018 drop at 94.08 and a potential test of July’s low at 93.71.
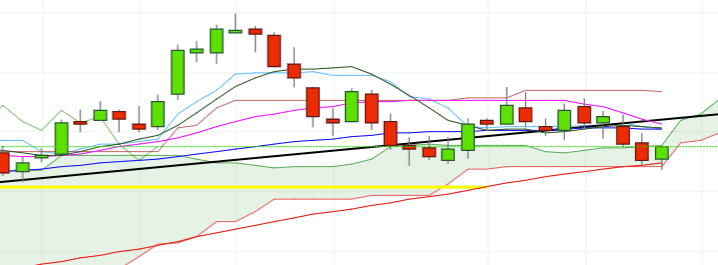
- Looking north, DXY should regain the (now) resistance line at 95.20, although the 55-day SMA (95.05), the 10-day SMA (95.06) and the 21-day SMA (95.13) should offer interim resistance.
DXY daily chart
Daily high: 94.76
Daily low: 94.36
Support Levels
S1: 94.32
S2: 94.11
S3: 93.78
Resistance Levels
R1: 94.86
R2: 95.19
R3: 95.40
