- The index is gathering further upside traction on Wednesday on the back of unabated jitters around the EM FX space, with the Turkish Lira still in centre stage.
- DXY is poised to advance further as long as the short-term support line at 94.60 holds and it continues to trade above the daily cloud. Immediate target arises at the psychological 97.00 milestone ahead of 97.87, where sits the 61.8% Fibonacci retracement of the 2017-2018 drop.
- So far, the index is paying little-to-none attention to the bearish divergence in the daily RSI, which could prompt a retreat to, initially, 96.04 (50% Fibo retracement of the 2017-2018 drop) seconded by the 95.65 (10-day SMA), the 200-week SMA at 95.45 and then 95.13 (21-day SMA).
- Looking at the broader picture, the buck remains supported by US-led trade tensions and prospects of further tightening by the Fed in the next months.
DXY daily chart
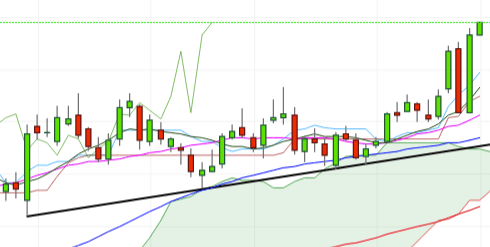
Daily high: 96.92
Daily low: 96.66
Support Levels
S1: 96.28
S2: 95.90
S3: 95.64
Resistance Levels
R1: 96.92
R2: 97.18
R3: 97.56
