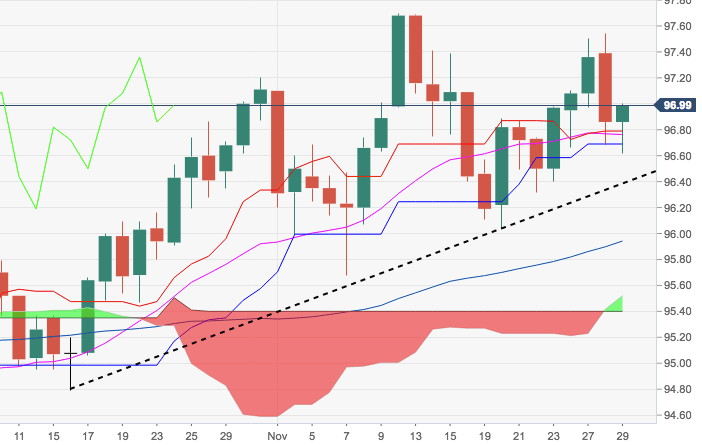
- The sharp sell-off in the buck on Wednesday following dovish comments from Fed’s Powell met support in the 96.60 region, just above the short-term support line, today at 96.38.
- The positive stance should remain well and sound while above this level, although yesterday’s bearish ‘outside day’ prompts some caution ahead.
- In the meantime, a visit to 2018 peaks near 97.70 remains well on the cards for the time being. The main risk facing this scenario stems from a potential upbeat tone in the Trump-Xi meeting and the subsequent easing of trade concerns.
DXY daily chart
Dollar Index Spot
Overview:
Today Last Price: 96.99
Today Daily change: 13 pips
Today Daily change %: 0.134%
Today Daily Open: 96.86
Trends:
Previous Daily SMA20: 96.75
Previous Daily SMA50: 96.02
Previous Daily SMA100: 95.57
Previous Daily SMA200: 93.83
Levels:
Previous Daily High: 97.54
Previous Daily Low: 96.69
Previous Weekly High: 96.98
Previous Weekly Low: 96.04
Previous Monthly High: 97.2
Previous Monthly Low: 94.79
Previous Daily Fibonacci 38.2%: 97.01
Previous Daily Fibonacci 61.8%: 97.22
Previous Daily Pivot Point S1: 96.52
Previous Daily Pivot Point S2: 96.18
Previous Daily Pivot Point S3: 95.67
Previous Daily Pivot Point R1: 97.37
Previous Daily Pivot Point R2: 97.88
Previous Daily Pivot Point R3: 98.22
