- EUR/GBP struggles around the bullish chart pattern’s support line.
- 200-HMA adds to the upside barriers, RSI recovery keeps buyers hopeful.
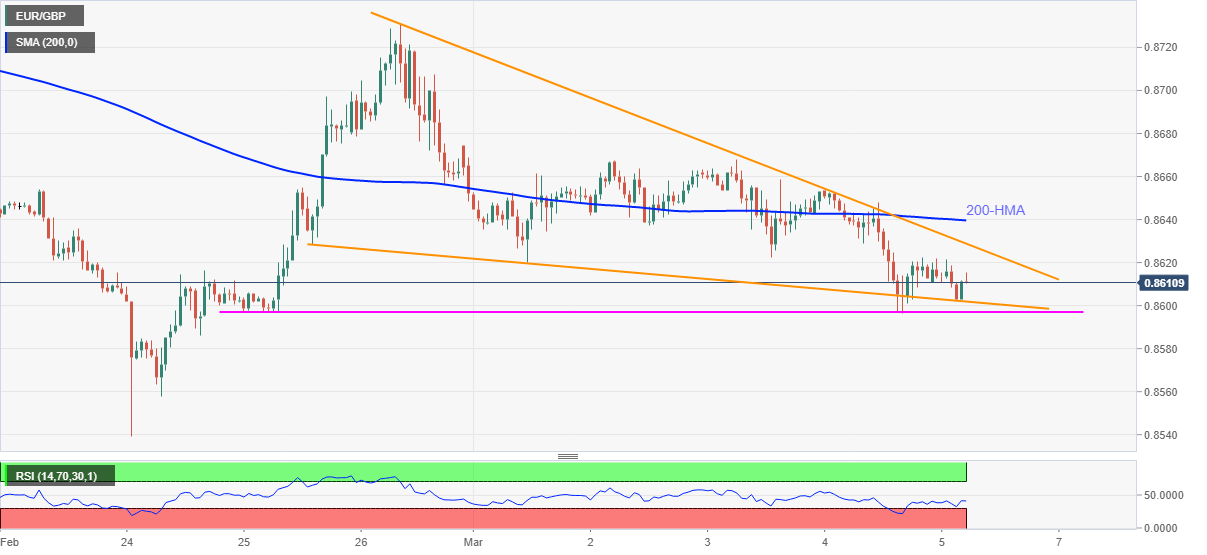
EUR/GBP sellers attack 0.8600, currently down 0.08% intraday around 0.8610, ahead of Friday’s European session. In doing so, the quote flirts with the support line of the one-week-old descending triangle formation.
Given the RSI recovery, EUR/GBP is likely to stay above the stated support line, at 0.8600 now. However, the pair’s upside moves depend upon the ability to confirm the bullish chart formation, as well as cross the 200-HMA.
For that, the EUR/GBP bulls not only need to cross the 0.8630 resistance line but also the 0.8640 HMA figures to eye the 0.8700 threshold.
Meanwhile, a downside break of the pattern’s support line near 0.8600 will be questioned by a horizontal line around 0.8597, a break of which direct EUR/GBP bears toward the multi-month low of 0.8539, marked the previous month.
Overall, EUR/GBP remains in the bearish trend but intermediate pullback can’t be ruled out.
EUR/GBP hourly chart
Trend: Recovery expected
